I Want the Needle and the Haystack: YARA + Security Analytics for Incident Response
by Uptycs
Friday, July 15th, 2022
I want the needle, and the haystack to go along with it. Attackers take advantage of siloed data and security tools to exploit systems using misconfigurations and move laterally. This lateral movement across different attack surfaces has attackers flowing between the control plane and data plane of your environment to escalate privileges and seek out targeted access.
Whether looking in real-time or historical, we need unified data from across the control plane and data plane that is normalized, ready to offer insights, and easily combed for deeper investigations using techniques such as YARA scanning. The rapidly evolving threat landscape means we need solutions that provide these deep real-time detections, but also a depth of telemetry and platform to easily investigate any aspect of a diverse cloud environment and container fleet.
Imagine an attacker using the Dirty Pipe vulnerability (CVE-2022-0847) to perform container escape, Dirty Pipe is a privilege escalation vulnerability in Linux kernels exploiting a flaw that allows attackers to write data to read-only files and gain root access. Here we have an attacker that can combine the escalation from Dirty Pipe with exploits in runtime services, runc or docker, gaining access to the node running your unprivileged container images. Once they have this root access to the node, attackers continue escalating privileges and runtime service misconfigurations to access the image registry and enter the K8s control plane. At the control plane layer, it becomes easier for an attacker to focus on capturing user credentials, entering targeted systems or accounts in the cloud environment, or masking themselves onto developer laptops to continue their movement across your environment.
Thinking strategically about this scenario, too often teams partition their container runtime services into two separate layers of monitoring tools and data logging: the audit and enforcement layer of your Kubernetes orchestration and then the actual data layer of your pods and nodes. When you isolate these monitoring tools, you are siloing the data and ultimately disrupting threat hunting and investigation techniques that allow you to detect and respond.
To perform dynamic investigations and combat scenarios like this increasingly common container escape, we need visibility into a variety of host data ranging from running containers, traditional endpoints, cloud logs, the K8s control plane, and more. Security tooling has to unify this data for stringing together complex detection patterns and also provide the adequate base layer for fast-moving CSIRT teams to perform incident response and root cause analysis.
Unifying cloud + container + endpoint telemetry
Uptycs builds on the open-source osquery to do just that. For the uninitiated, osquery is an open-source solution that gathers an unprecedented level of telemetry from your fleet. Using osquery, every process and socket event happening on your operating system is recorded and normalized into SQL tables to query just about any action on your OS (hence the name, OS-query!). This powerful solution makes it incredibly easy to investigate and manage your cloud workloads, VMs, micro-VMs, containers, and traditional endpoints.
Uptycs has extended osquery to unify your cloud and Kubernetes security analytics, using cloudquery and kubequery. This correlates data from your attack surfaces across the control plane and the data plane for cloud workloads, containerized environments, Kubernetes orchestrations, and traditional endpoints into a structured SQL format. With this platform approach to security, data is normalized at the point of collection and ready to analyze in real-time with no lag to correlate, join, or parse telemetry from across systems.

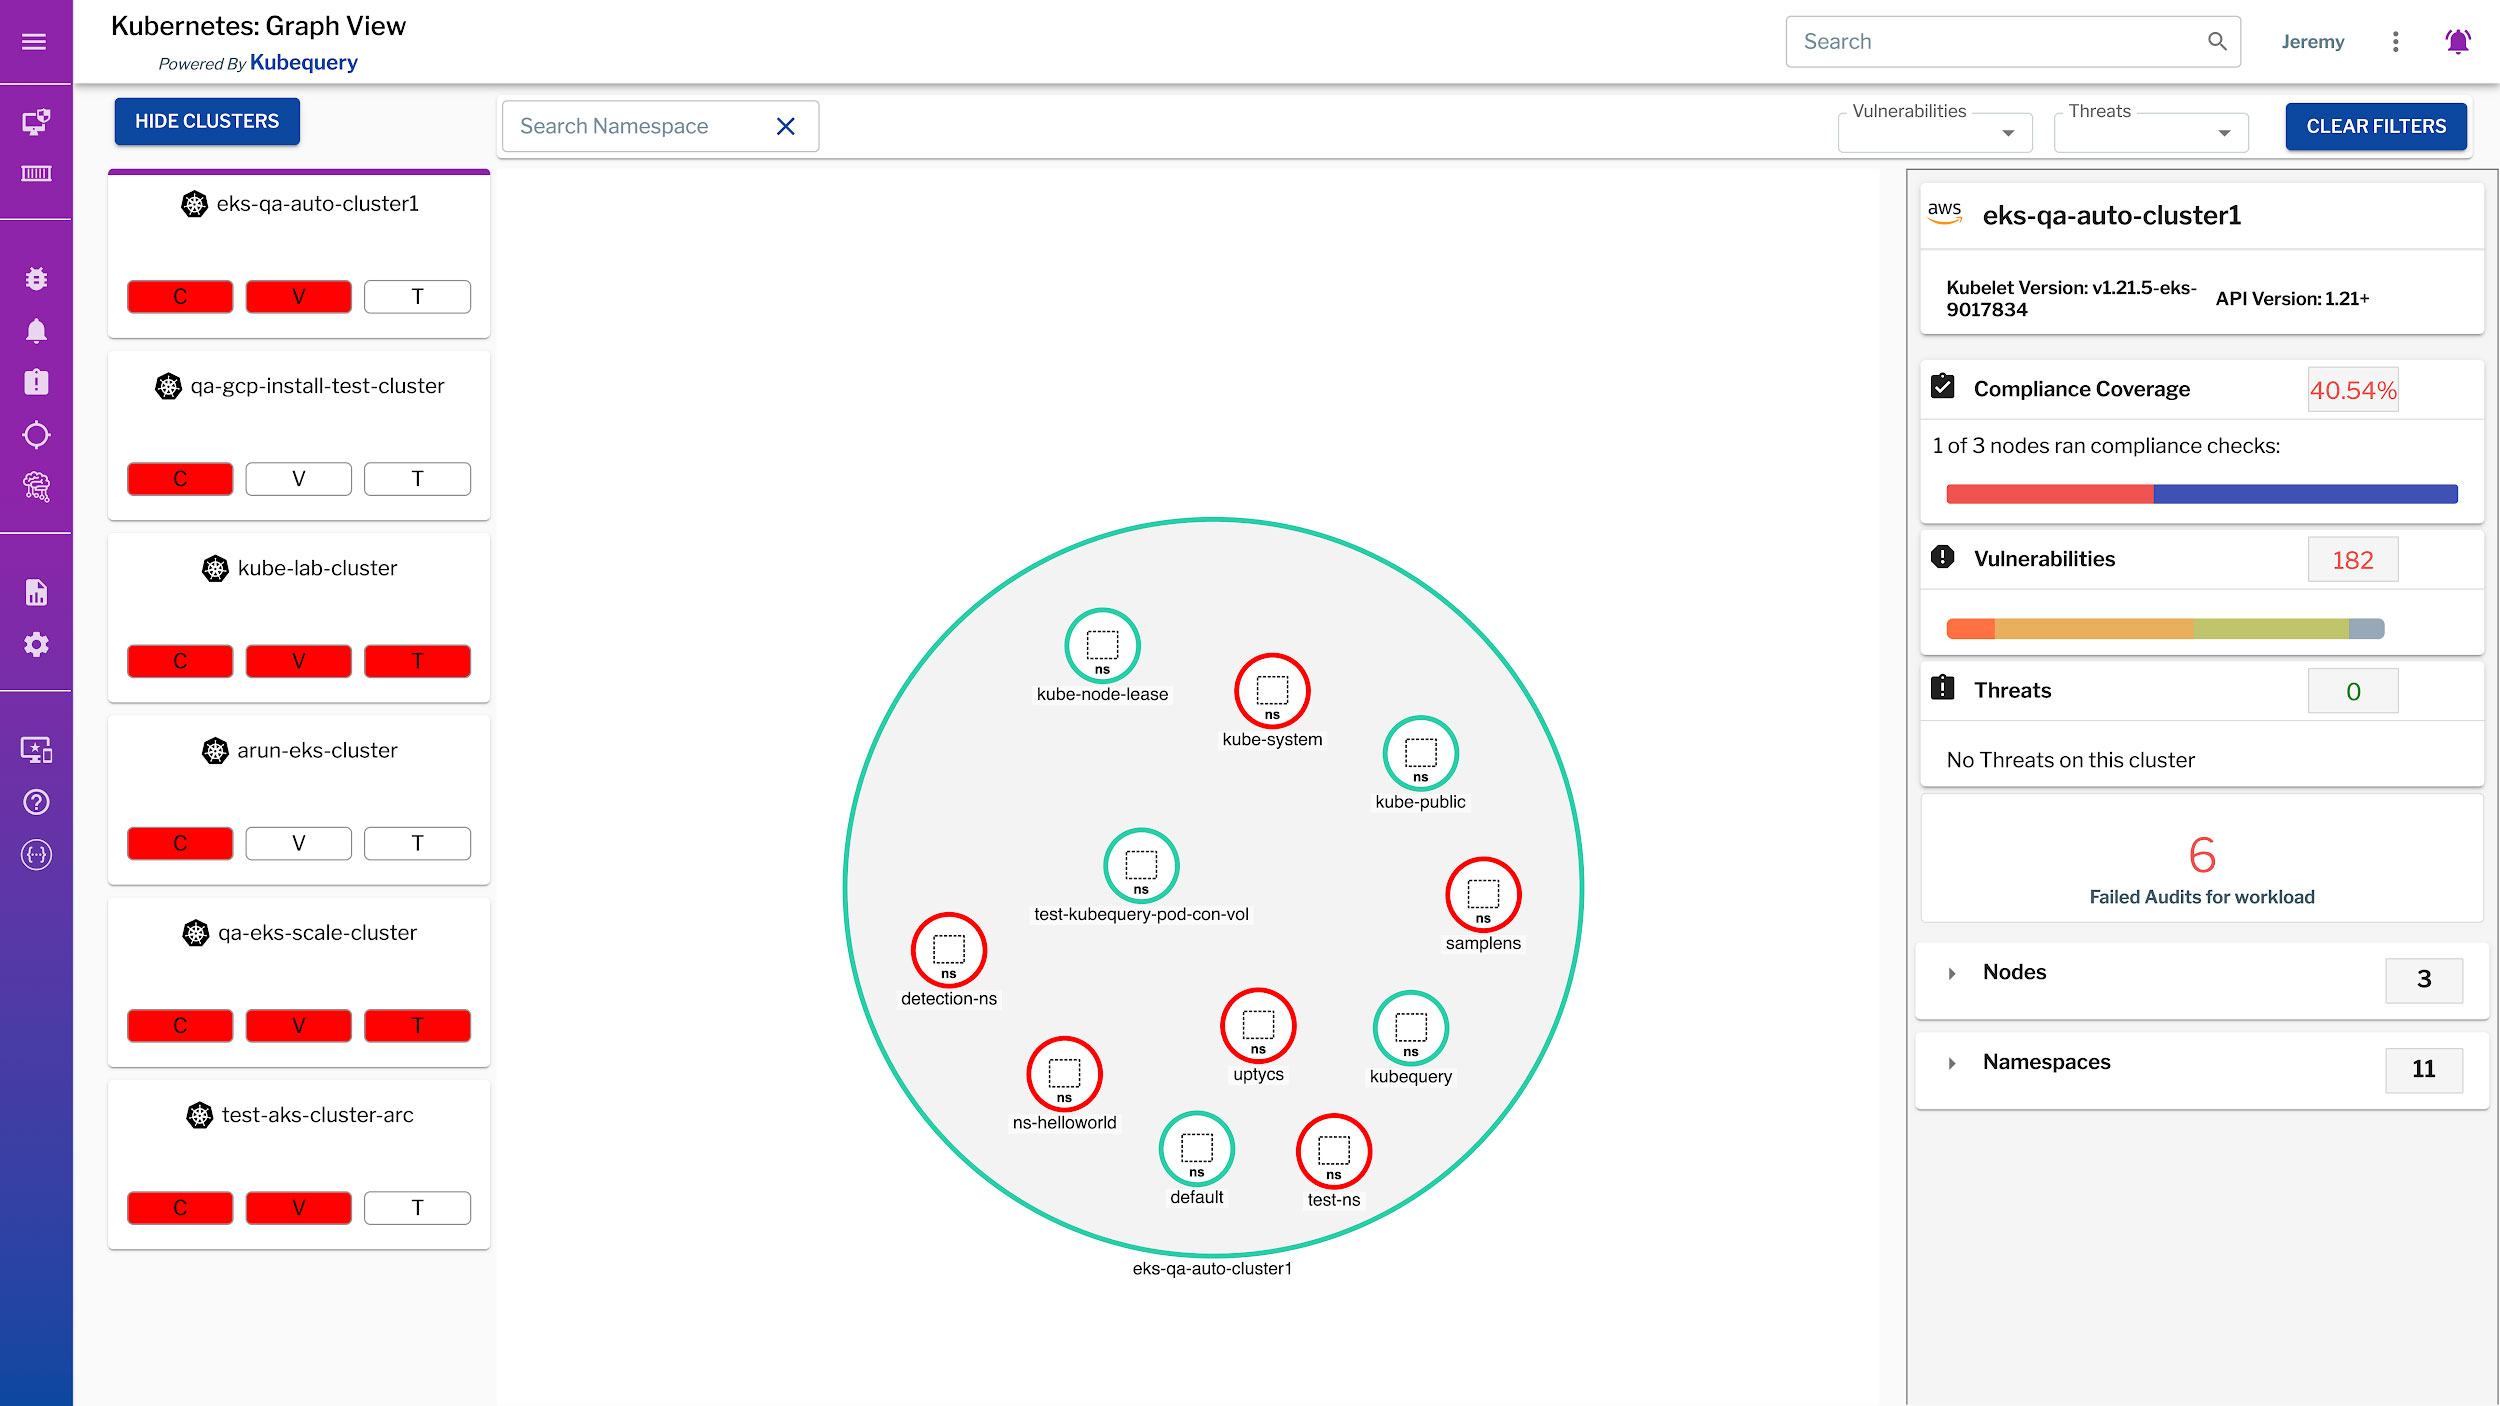
Uptycs incorporates Kubernetes system telemetry for inventory, compliance, vulnerability scanning, and threat detection
Security analytics + YARA for incident response
Unified data from across the control and data planes gives you the strongest base on which to conduct investigations, incident response, and threat hunting along with traditional security operations. Siloed tools and data are a detriment to fast moving, effective CSIRT teams. The power of this foundation in security analytics is that Uptycs provides out-of-the-box solutions for teams, but also gives you a platform with all the socket and process event data needed to build tailored YARA scans or detections frameworks that rapidly respond to emerging threats and incidents.
This gives us the foundation for a solution that doesn’t claim to do everything, but does give you the power to do anything. Flexible YARA scanning with threat hunting lets teams scan workloads and drill down into shaded .JAR files. For example with Log4Shell, CSIRT teams used YARA scanning to check in real-time for proper configurations, but also look historically at whether exploit attempts had been made for the Log4Shell vulnerability. When a new zero day occurs for an existing piece of software or piece of software that is misconfigured, this can be exploited before a patch is published. Using YARA, researchers scan files and running processes to monitor workloads for APT signatures and exploit attempts before the patch even arrives.
This breaks down into five ways to leverage YARA scanning at scale, ultimately letting you scan over a million hosts in under 30 minutes:
- Whenever a piece of software is launched, use YARA to check if a textual or binary signature is present in the processes upon creation or launch.
- For file integrity monitoring (FIM), use YARA to validate new files as they are created.
- Take a proactive approach to file monitoring, and scan in real-time for YARA signatures in existing files.
- Investigate running processes in real-time, scanning for signatures in all running process events.
- Uptycs has compiled the toolkits of 50+ APT threat groups, with customized YARA detections for all APT toolkits. These YARA profiles are fully customizable and can be extended easily as new threats emerge.
Looking back: Investigations using historical data
Storing data for historical investigations is increasingly vital, teams require the ability to peer into the previous state of the OS for incident investigation. We store data for up to 90 days, meaning that the amount of process and socket event data is enough to reconstruct and investigate the “what happened, where and how” even on workloads that may no longer be running.
If you are interested in learning more about what kind of needles we are finding, and how we build YARA scans or reconstruct operating systems using the haystacks we have on hand—now you know who to connect with. Thanks and happy hunting!

