What is EPSS?
EPSS provides a fundamentally new capability for efficient, data-driven vulnerability management. It is a data-driven effort that uses current threat information from CVE and real-world exploit data. The EPSS model produces a probability score between 0 and 1 (0 and 100%), where the higher the score, the greater the probability that a vulnerability will be exploited.
Using EPSS for Better Vulnerability Management
EPSS is estimating the probability of exploitation activity, which is just one of many considerations in a risk-based approach to vulnerability management. Because of that, EPSS should never be treated as a risk score. Other factors, such as how accessible vulnerable assets are to attackers, the type of weakness the vulnerability presents, the asset's purpose and value, etc., may all be factors to consider when prioritizing which vulnerabilities should be addressed.
In regard to the (overly simplistic) risk formula, Risk = Threat x Vulnerability x Impact, EPSS relates only to the threat component. Asset owners should consider many other aspects of the vulnerability, their network, the asset, and so on before making a final decision to remediate or delay remediation. However, a lower EPSS score should represent a lower threat score (EPSS is never zero), and thus if everything else is held constant a lower overall risk. Risk analysis is obviously a complicated topic. EPSS is only offering an improved measurement on one aspect of the overall picture, and should therefore be treated as such.
Using EPSS and CVSS Together
The figure below shows the correlation between EPSS and CVSS scores based on data from 05-16-2021. Recall that EPSS produces prediction scores between 0 and 1 (0 and 100%) where higher scores suggest higher probability of exploit. Each dot represents one or more vulnerabilities (CVEs). Some vulnerabilities are labeled for illustrative purposes.
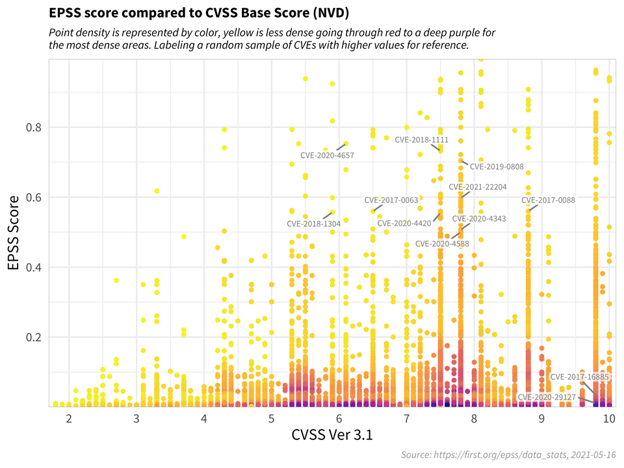
First, observe how most vulnerabilities are concentrated near the bottom of the plot, and only a small percent of vulnerabilities have EPSS scores above 50% (0.5). While there is some correlation between EPSS and CVSS scores, overall, this plot provides suggestive evidence that attackers are not only targeting vulnerabilities that produce the greatest impact, or are necessarily easier to exploit (such as for example, an unauthenticated remote code execution).
This is an important finding because it refutes a common assumption that attackers are only looking for — and using — the most severe vulnerabilities. And so, how then can a network defender choose among these vulnerabilities when deciding what to patch first?
CVSS is a useful tool for capturing the fundamental properties of a vulnerability, but it needs to be used in combination with data-driven threat information, like EPSS, in order to better prioritize vulnerability remediation efforts.
For the sake of discussion, consider the diagram below, which has been annotated to generally illustrate vulnerability priortitization.
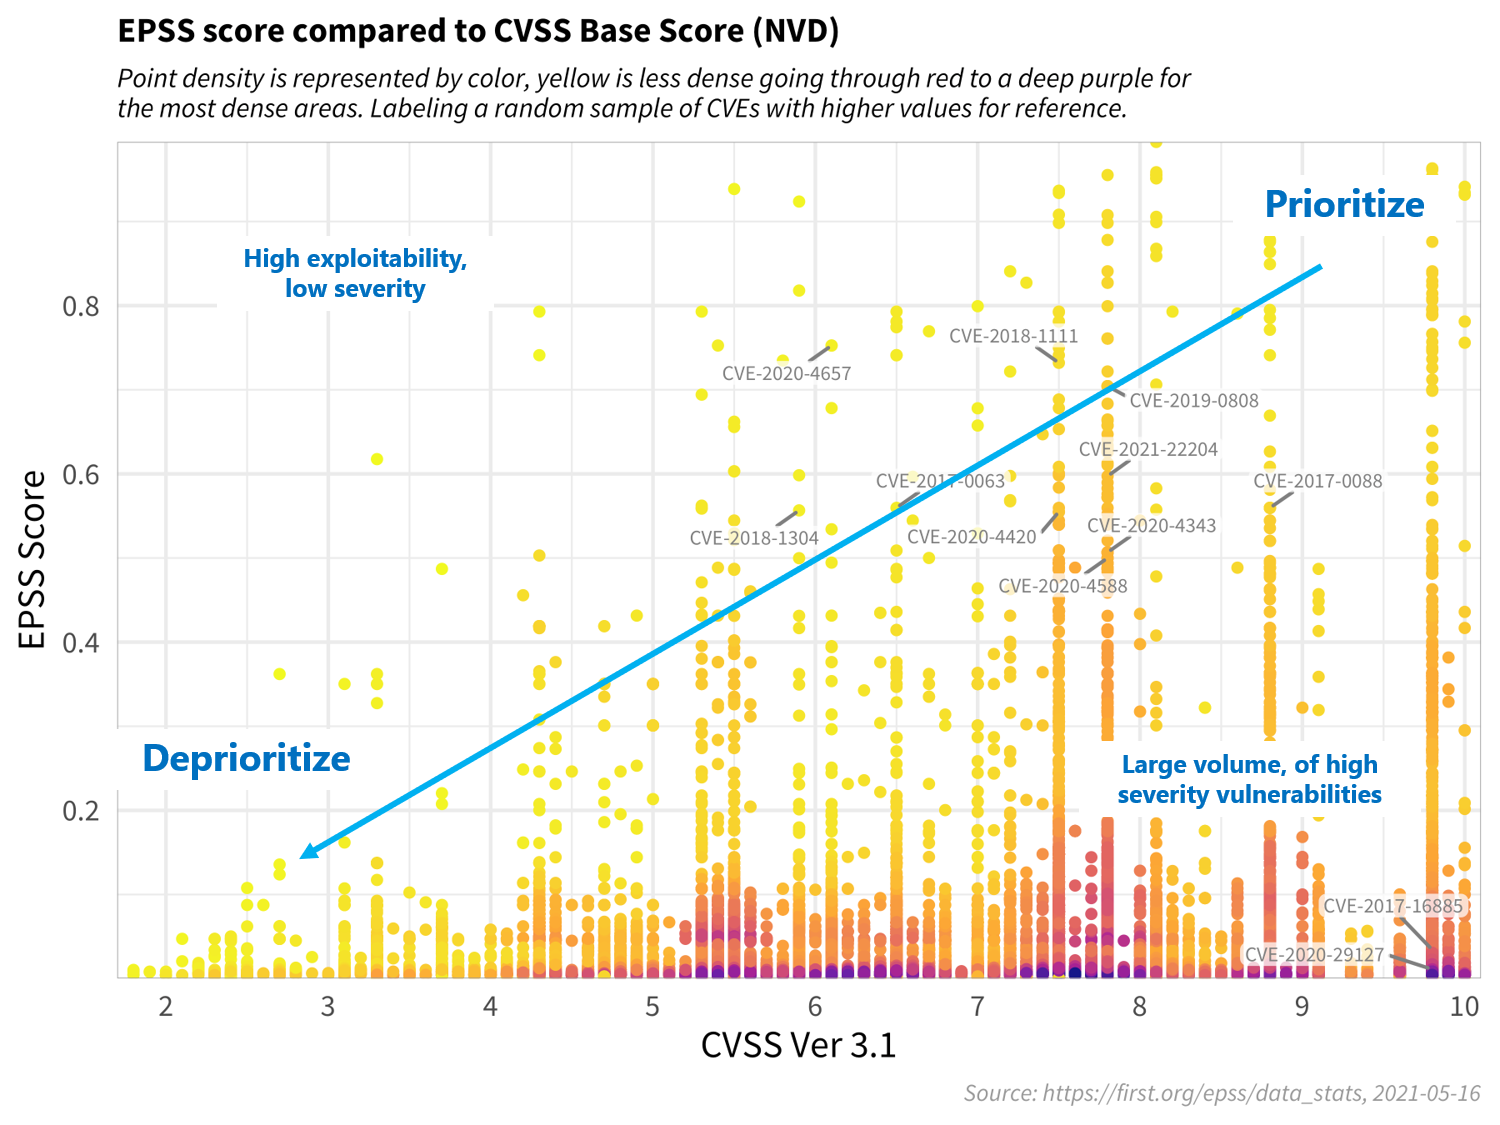
Vulnerabilities in the bottom left represent those that have both a lower probability of being exploited, and would incur a lower severity impact to the information system, and can therefore be deprioritized. Similarly, vulnerabilities in the upper left quadrant may be more likely to be exploited, but, on their own, would not critically impact the information system. (Further research, however, should be conducted in order to better understand how these sorts of vulnerabilities may be used in a chained attack.)
Vulnerabilities in the bottom right represent those that, while may severely impact the information system, are much less likely to be exploited, relative to others, but should still be watched in the event that the threat landscape changes.
Vulnerabilities in the upper right quadrant, on the other hand, are the most critical kinds of vulnerabilities which are both more likely to be exploited, and could fully compromise the information system, and should therefore be patched first.
This decision strategy as described above emphasizes the tremendous capability of EPSS. A network defender who has typically had to address thousands or tens of thousands of exposed vulnerabilities, is now able to spend fewer resources, to patch more vulnerabilities that are much more likely to be exploited. This capability to differentiate among vulnerabilities has never before been possible.
What Else Can EPSS Do?
EPSS has additional benefits for other stakeholders, especially for national policy.
1: Smarter National Vulnerability Management Policies
First, in 2019 the US Department of Homeland Security (DHS) issues a Binding Operational Directive (19-02, https://cyber.dhs.gov/bod/19-02/) to all federal agencies describing how they must patch Critical vulnerabilities (i.e. those with CVSS scores of 10) within 15 days of detection, and High Severity vulnerabilities (those with CVSS scores above 7.0) within 30 days of detection. As illustrated in the discussion above, this could reasonably encompass thousands of vulnerabilities, most of which will never be exploited, and would therefore waste valuable federal resources. Instead, it becomes clear that any national remediation strategy should instead consider both the severity of a vulnerability, and the exploitability when issuing directions to federal agencies (or any network defender).
2: EPSS for National Security Threat Assessments
Second, EPSS has national security benefits, as well. The US Government maintains a small, but controversial process concerning the use of zero-day vulnerabilities. The Vulnerability Equities Process (VEP, https://trumpwhitehouse.archives.gov/sites/whitehouse.gov/files/images/External%20-%20Unclassified%20VEP%20Charter%20FINAL.PDF) for deciding how to use zero day vulnerabilities. As explained in the VEP Charter, the tension at play is whether the zero-day vulnerability should be used for National Security purposes, or disclosed to the vendor (and public) for patching.
National Security arguments (by offensive equity partners) can be quite compelling. However, objectively assessing and presenting a defensive equity posture can be quite difficult because of the lack of available information about the number and types of vulnerable systems across the Nation. But now, with EPSS, there is an objective and repeatable way for a Federal Agency like DHS to combine an EPSS score with information about national-level vulnerabilities, in order to capture the specific threat posed by one of these vulnerabilities. Again, we believe this is a powerful capability that has never before available.
3: EPSS Can Scale, to Produce System, Network, and Enterprise-level Exploit Predictions
EPSS predicts the probability (threat) of a specific vulnerability being exploited, but it can also be scaled to estimate the threat for multiple vulnerabilities on a server, a subnet, mobile device, or at an enterprise level. This capability is possible because of a statistical property about the independence of events, and requires simply computing the probability of at least one event occurring.
For example, consider an organization with 100 vulnerabilities, each with a 5% chance of being exploited. The question of great interest to a network defender might be: what is the probability that at least one of those vulnerabilities will be exploited, and therefore what is my overall threat?
The probability of at least one event occurring is simply the complement (opposite) of no events occurring, that is:
P(at least one exploited vulnerability) = 1 - P(no vulnerabilities are exploited).
Where, the probability of no vulnerabilities is the linear product of each vulnerability not being exploited. In our case, since each vulnerability has a 5% chance of being exploited, they each have a 95% chance of not being exploited. And since there are 100 of them, we can write this as:
P(at least one vuln exploited) = 1 - P(no vulns are exploited)
= 1 - P(one vuln not exploited)^100
= 1 - 0.95^100
= 0.994
Which says that the probability of at least one of the vulnerabilities being exploited is 99.4%.
Further, once this has been calculated, it becomes a potentially useful metric to gauge and compare one’s information security posture over time, i.e. by simply comparing this value over time, or across devices, or organizations.
Examining Actual Exploit Data
The figure below shows actual exploit observations for a sample of vulnerabilities. Each row represents a separate vulnerability (CVE), while each blue line represents an observed exploit. The red dots represent the time of public disclosure of the CVE. (Note that we are not tracking whether these exploits are successful or not.)
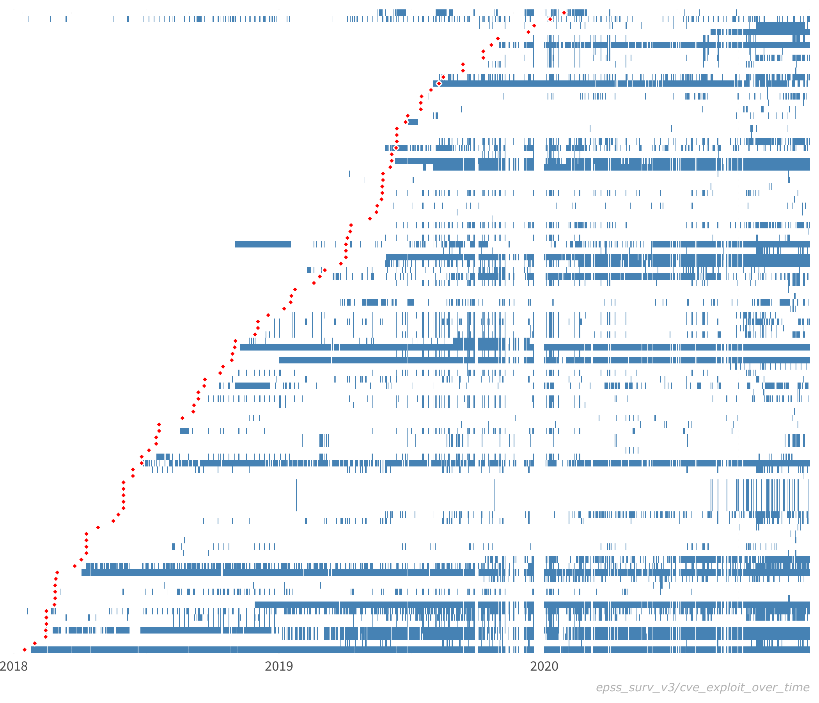
While it is difficult to draw conclusive insights from these behaviors, we can comment on general characteristics. First, simply viewing these data is interesting because they provide a novel view into real-world exploit behavior. Indeed, it is exceedingly rare to see these kinds of data publicly available, and we are fortunate to be able to share them with you. It is also thought-provoking to examine and consider the different kinds of exploit patterns:
- Duration: Some vulnerabilities are exploited over a short period of time (days, weeks), while others are exploited over much longer periods of time (years). For example, some vulnerabilities in this sample have been exploited for nearly the full time window of 3 years.
- Density (intensity, prevalence): Some vulnerabilities are exploited many times during their overall duration, while others are only exploited a few times. For example, notice how exploits for some vulnerabilities occur repeatedly throughout the lifespan of the exploit, while for other vulnerabilities, there are long periods of inactivity. In addition, some vulnerabilities seem to be exploited nearly continuously (one at the bottom) and therefore appear as almost a solid blue line.
- Fragmentation: In addition to the number of times a vulnerability is exploited within its duration (i.e. density), we may also be interested in the fragmentation of exploit behavior. That is, the measure of consistent exploitation day after day, versus exploitation followed by periods of inactivity.
- Time to first exploit (delay): From the data we collect, some vulnerabilities are exploited almost immediately upon public disclosure, while for other vulnerabilities, there is a much longer delay until first observed exploit. And indeed, this figure shows a number of vulnerabilities that are exploited before public disclosure. (Given the many factors involved in CVE disclosures, we make no comment on whether or not these are proper zero day vulnerabilities.) For example, some vulnerabilities in this sample are exploited immediately, while others take 6 months or more to be exploited.
- Co-exploitation: Some vulnerabilities appear to be exploited at the same time as others. This kind of co-exploitation may be suggestive of vulnerability chaining, the practice of using multiple, successive exploits in order to compromise a target.
