Probability, Percentiles, and Binning - How to understand and interpret EPSS Scores
By Sasha Romanosky and Jay Jacobs
One of the issues users must consider when implementing EPSS is interpreting the results. Currently, EPSS provides both a probability of observing exploitation activity in the next 30 days, and a percentile (a rank ordering of probabilities from highest to lowest). In addition (or alternatively) some users may want to apply ordinal labels (high, med, low) to EPSS scores, or other transformations. In this article, we discuss the advantages and disadvantages of multiple approaches.
Probability
The native and most direct output of the EPSS model is a probability which is expressed as a value between 0 and 1. The figure below shows the probability distribution of EPSS scores for over 170,000 vulnerabilities as of March, 2022.
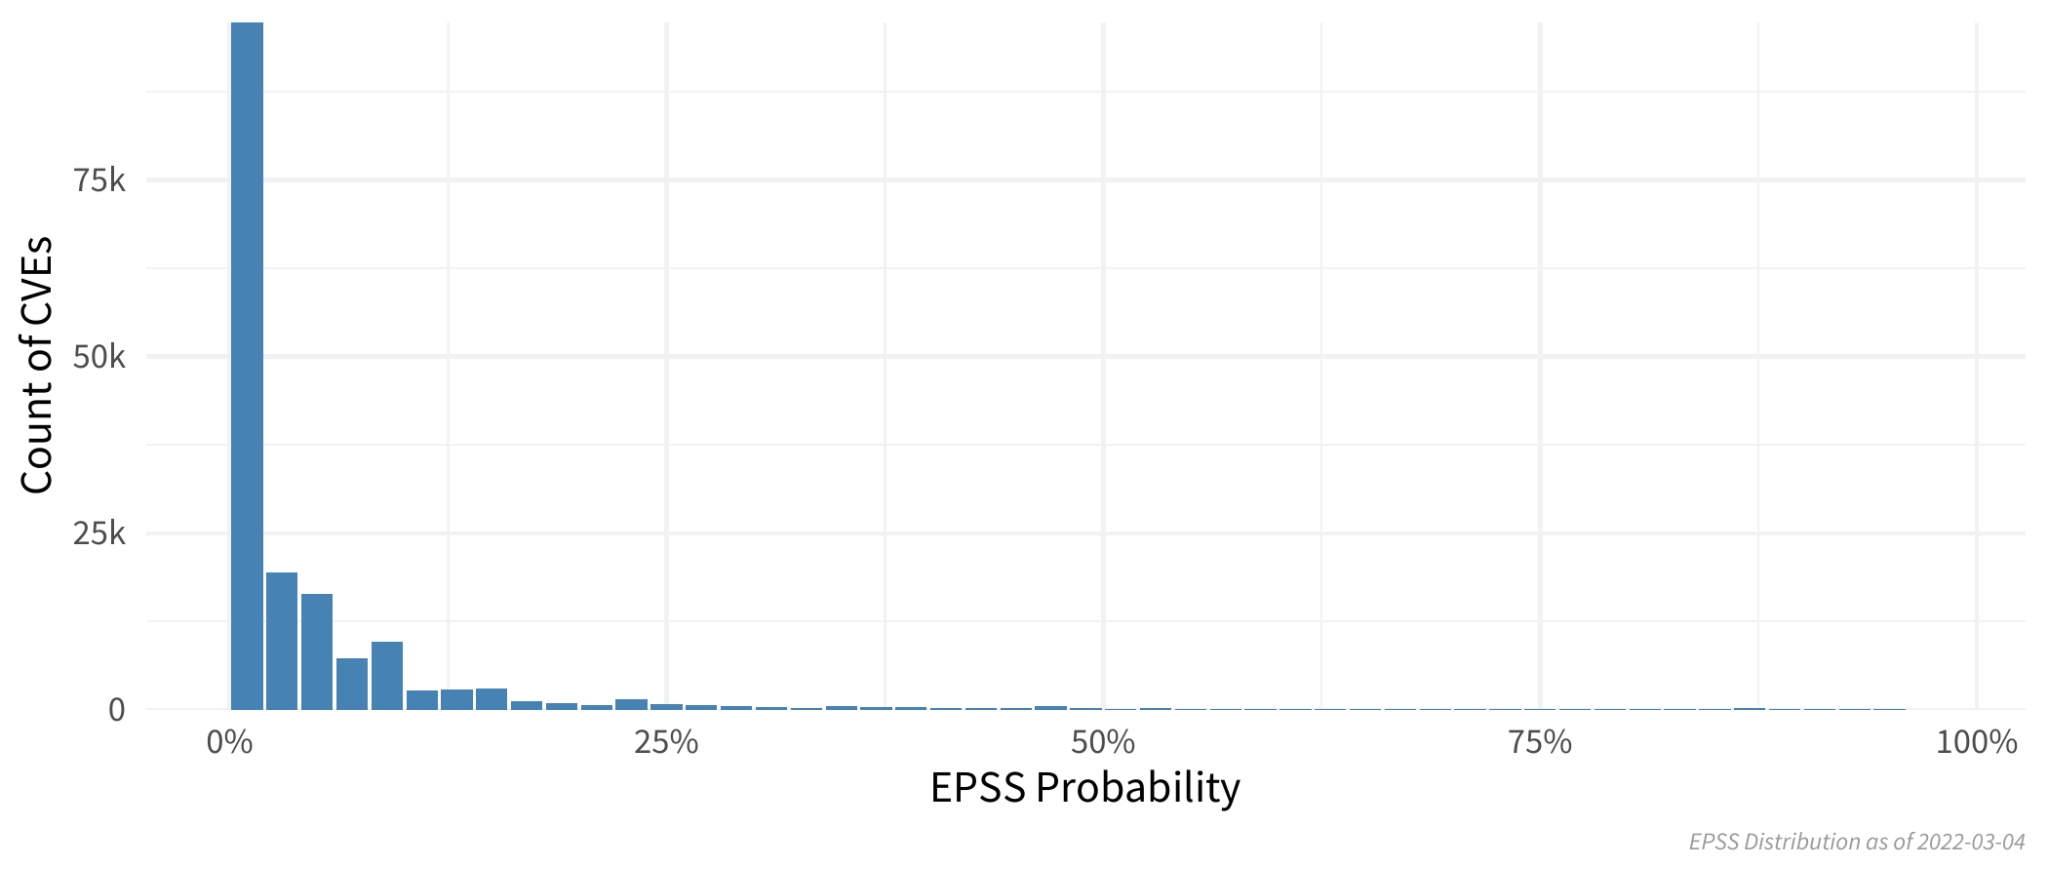
Clearly, the vast majority of vulnerabilities score below 25%, and even below 10%. This reflects a global measure of vulnerability exploitation in the wild. Indeed, only around 5% of all vulnerabilities are ever exploited in the wild (see references at the end of this article).
On one hand, using the native EPSS probabilities provides the purest form of the EPSS score, and because the result is a measure of probability, it can be used properly in mathematical operations. For example, EPSS probabilities can be scaled, in order to estimate the threat to any IT system containing many vulnerabilities, such as a laptop, a network, or a corporate office. One need only invoke standard statistical properties in order to compute the probability of at least one vulnerability being exploited (e.g. see https://www.statology.org/probability-of-at-least-one-success/).
On the other hand, interpreting meaning from probabilities is notoriously difficult for people, especially when most values are compressed into a relatively small range (e.g. see https://www.youtube.com/watch?v=JhfMkmzaNdU). For example, how are users supposed to interpret the overall importance of a vulnerability with a probability of 0.212? Or alternatively, how should we think about comparing the relative difference in threat between a probability of 0.115 and 0.087? Yes, one is larger than the other, but how much larger? How much of a difference in threat does the former pose, relative to the latter?
And so, while probabilities are the native output of the EPSS model, they can sometimes be difficult to internalize. And so next, we consider the use of percentiles.
Percentiles
Percentiles are a direct transformation from probabilities and provide a measure of an EPSS probability relative to all other scores. That is, the percentile is the proportion of all values less than or equal to the current rank. This transformation is a one-way function, meaning we can derive the percentiles from the probabilities, but we cannot reconstitute probabilities from percentiles. The figure below plots EPSS percentiles (y-axis) vs EPSS probabilities (x-axis).
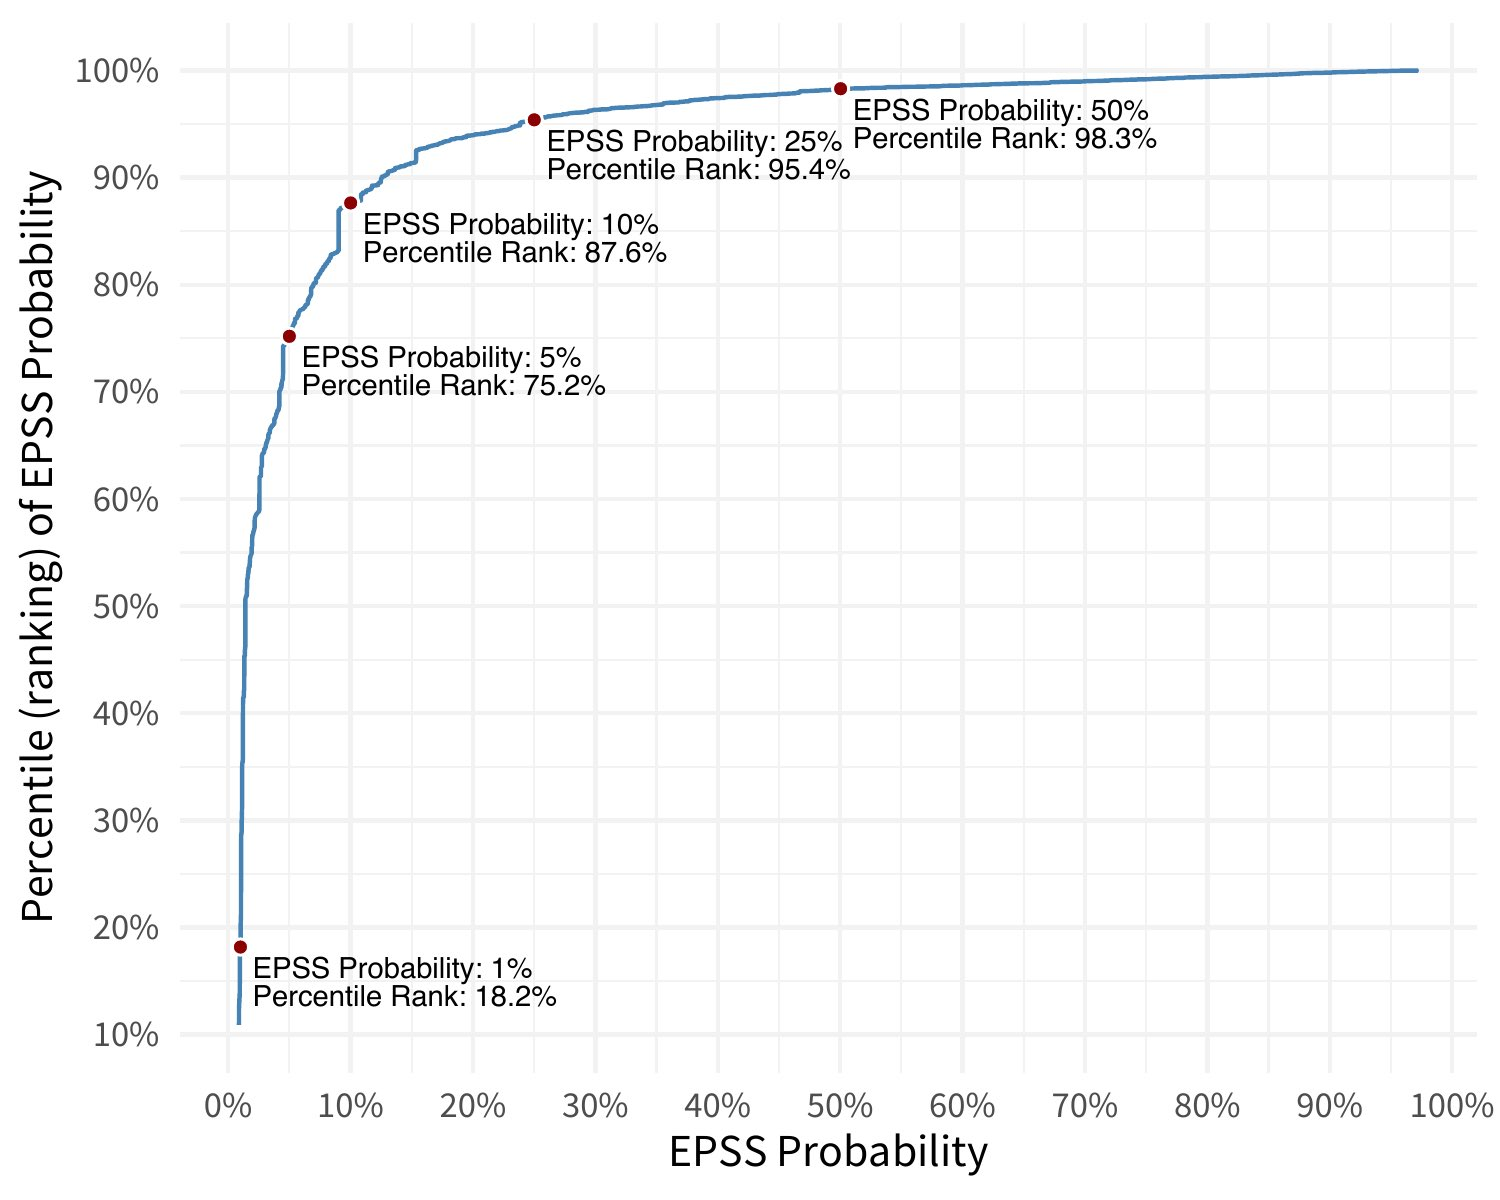
For example, an EPSS probability of just 0.10 (10%) rests at about the 88th percentile -- meaning that 88% of all CVEs are scored lower. Said another way, a vulnerability with an EPSS probability of 10%, sits in the top 12% of all scored vulnerabilities. And so while 10% is an objectively low probability, relative to the entire EPSS distribution (170,000+ vulnerabilities), it is among the highest scored.
EPSS probabilities reflect an absolute (global) reality of vulnerability exploitation by taking into account the small base rate of exploitation. Because of this, communicating EPSS scores as a probability may dampen the significance of vulnerability exploitation for some. After all, a 10% chance of exploitation is an objectively small probability. But keep in mind that out of all the vulnerabilities with a 10% chance of exploitation, we would expect about 1 in every 10 vulnerabilities to actually be exploited in the wild in the next 30 days. However, just the probability of 0.1 or 10% may be perceived as low and therefore affect the speed at which someone chooses to remediate the vulnerability.
On the other hand, percentiles communicate rank ordering, and therefore convey a localized context. That is, they better communicate the relative importance. Knowing a vulnerability is ranked in the 88th percentile (or top 12%), may be perceived very differently than seeing just the absolute probability of 10%. And so while a probability alone (10%) may be difficult to interpret for some, adding in percentiles (88th) may provide the relative context needed for well-informed prioritization decisions. This highlights a very important difference between probability and percentile for EPSS scores.
EPSS probabilities convey a global, or overall, sense of the threat of exploitation, while percentiles provide a relative, or localized, measure of threat.
Another consideration when working with percentiles is that they are based on every published CVE, and it is unlikely that any organization is dealing with every CVE. Therefore, percentile values may change for a given subset of vulnerabilities. For example, when a user considers only those vulnerabilities relevant to her network environment, the percentile values will change -- because the sample of total vulnerabilities will change. The EPSS probability will not change, but the relative position (ranking) of one vulnerability to another will very likely change.
Binning
A third alternative to presenting EPSS probabilities is with categorical (ordinal) labels, such as "fix now / fix later," or "low, medium, high, critical." Bins provide a simple heuristic for users, and bypasses the cognitive effort required to process numerical distributions of values. Heuristics are important and useful mental shortcuts that we employ every day when making decisions, and can also be useful here.
However, there are a number of problems with binning. Bins are, by construction, subjective transformations of, in this case, a cardinal probability scale. And because the bins are subjectively defined, there is room for disagreement and misalignment across different users. There is no universal "right" answer to what the cut off should be between a high, and medium, or medium and low.
Moreover, arbitrary cutoffs force two scores, which may be separated by the tiniest of a value, to be labeled and then handled differently, despite there being no practical difference between them. For example, if two bins are set and the cutoff is set at 0.5, two vulnerabilities with probabilities of 0.499 and 0.501 would be treated just the same as two vulnerabilities with probabilities of 0.001 and 0.999. This kind of range compression is unavoidable and so any benefits from this kind of mental shortcut must be weighed against the information loss inevitable with binning.
For these reasons, EPSS does not currently bin EPSS scores using labels. However, the EPSS SIG always welcomes constructive feedback and suggestions for how to better present this information. Send comments to epss-sig@first.org.
Summary
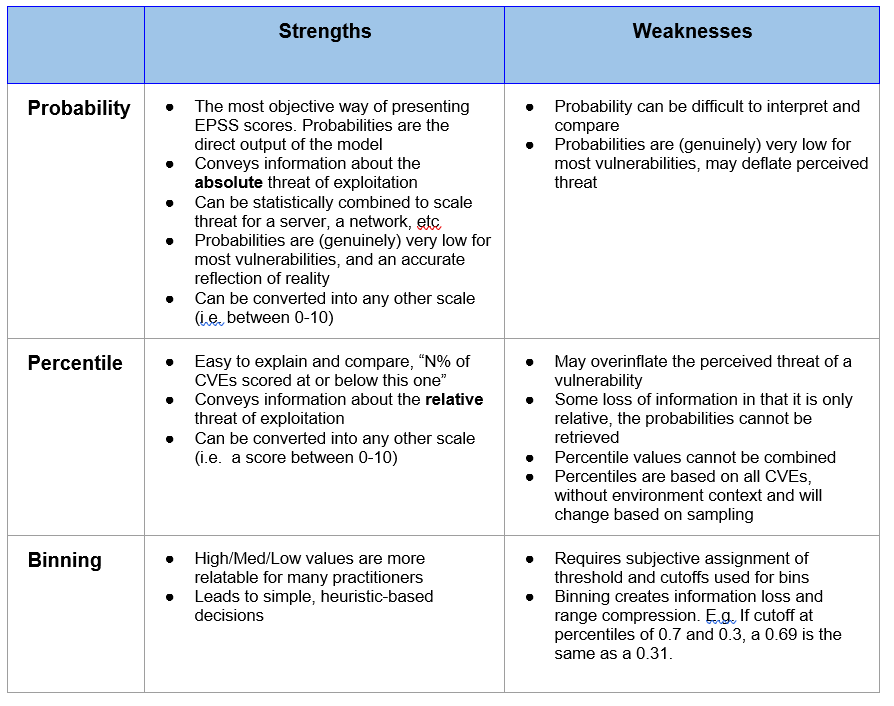
Below we summarize the advantages and disadvantages of these three approaches.
EPSS Recommendations for Communicating EPSS Scores
It is the official guidance and recommendation of EPSS that:
- When communicating a single "EPSS score," that value should be the probability score (not the percentile). It can be expressed as either a decimal value (0.153) or a percent (15.3%), though the prefered method is a percent.
- As often as possible, the percentile should be communicated with the probability and should include the appropriate suffix (i.e. "st", "nd", "rd", "th") for display. For example, "15.3% (92nd)" implies that the vulnerability has a 15.3% probability, and is ranked in the 92nd percentile.
- If the presentation is for public consumption, the percentile should be the percentile included in EPSS and based on all public CVEs. However, if the percentile refers to a subset of CVEs and is therefore recalculated, it must be very clear to the consumer that the percentile is based on a different sample than the EPSS-supplied value.
- In the raw data and API data feeds, EPSS will only provide the probability as a decimal value between 0 and 1, and the percentile ranking for all CVEs as a decimal value between 0 and 1. This allows the values to be read as numeric values in any application and it is up to the consumer to transform it for human presentation or decision-making.
References regarding probability of exploitation:
● "Data science lets you focus on the 3% of vulnerabilities likely to be exploited," Tenable, Predictive Prioritization
● "5.7% of CVEs exploited in the wild," Fortinet, Threat Landscape Report Q2 2018
● "According to our data sources, less than 2% of CVEs have been actively exploited in the wild," Kenna/Cyentia, Prioritization to Prediction volume 1.
● "Around 3.4% of CVEs published in 2017 have so far been incorporated into malware and exploit kits, " NopSec 2018 State of Vulnerability Risk Management
