Every year we make a prediction to the number of vulnerabilities we expect to see published by NVD. We define this as the number published between New Year’s Day in 2023 to New Year’s Eve 2023, which is not the same as CVE’s that begin with 2023 as an identifier. In other words, there are CVE’s that come out within the 2023 calendar year that have different prefixes. For example, CVE 2005-10002 was published in 2023. So we would include that in our counts, and our forecasts for 2023.
So, let's look at 2023 in review. After all we can't improve if we don't score our results from previous year’s predictions!
We make both quarterly and yearly forecasts of NVD data, which we think of as tactical and strategic in value.
So for last quarter our forecast was:
Count
mean
mean_se
mean_ci_lower
mean_ci_upper
2023-12-31
7913.288319
584.517327
6767.655409
9058.921229
2024-03-31
8249.169015
697.592218
6881.913392
9616.424638
The count of published NVD vulns was: 7972.0
The difference was: 58.71168061893604
So we predicted 7913, but 7972 were published. The statistically literate reader will notice that this is comfortably within our both our confidence intervals and our mean standard error. We were off by 59, but that is a variance we hope you can live with. We know from our research these quarterly forecasts are less accurate than our yearly forecasts, but since they are also smaller, the differences are often less in practice. The point is simple: if you manage tactical patching of vulnerabilities, it helps to know how many to expect your teams and tools to handle this quarter. Between this and the brilliant work of the EPSS working group, you should have a handle on what to patch or write detections for.
So how did we do on our yearly forecast for 2023?
For the public record, you can see in github that we made this prediction 10 months ago here.
Count
mean
mean_se
mean_ci_lower
mean_ci_upper
2023-12-31
29532.488725
095.291852
25425.792158
33639.185291
2024-12-31
32886.827086
3003.375904
27000.318482
38773.335691
30913 vulnerabilities were published by NVD in the calendar year of 2023. However, we predicted 29532 +/- 2095. Verifying ourselves…30913-29532 means we were off by 1381, or roughly 4.5% per cent. You’ll notice that 1381 is within our standard prediction error, and VERY comfortably within our confidence intervals. If you need tighter bounds of uncertainty do get in touch and we'll see if we can improve things for your use case. We think this approach is consistently superior to a growth model of vulnerabilities, and also more adaptable to seasonal variations, changes in the number of CNAs or bug bounties, or other factors in vulnerability publication rates.
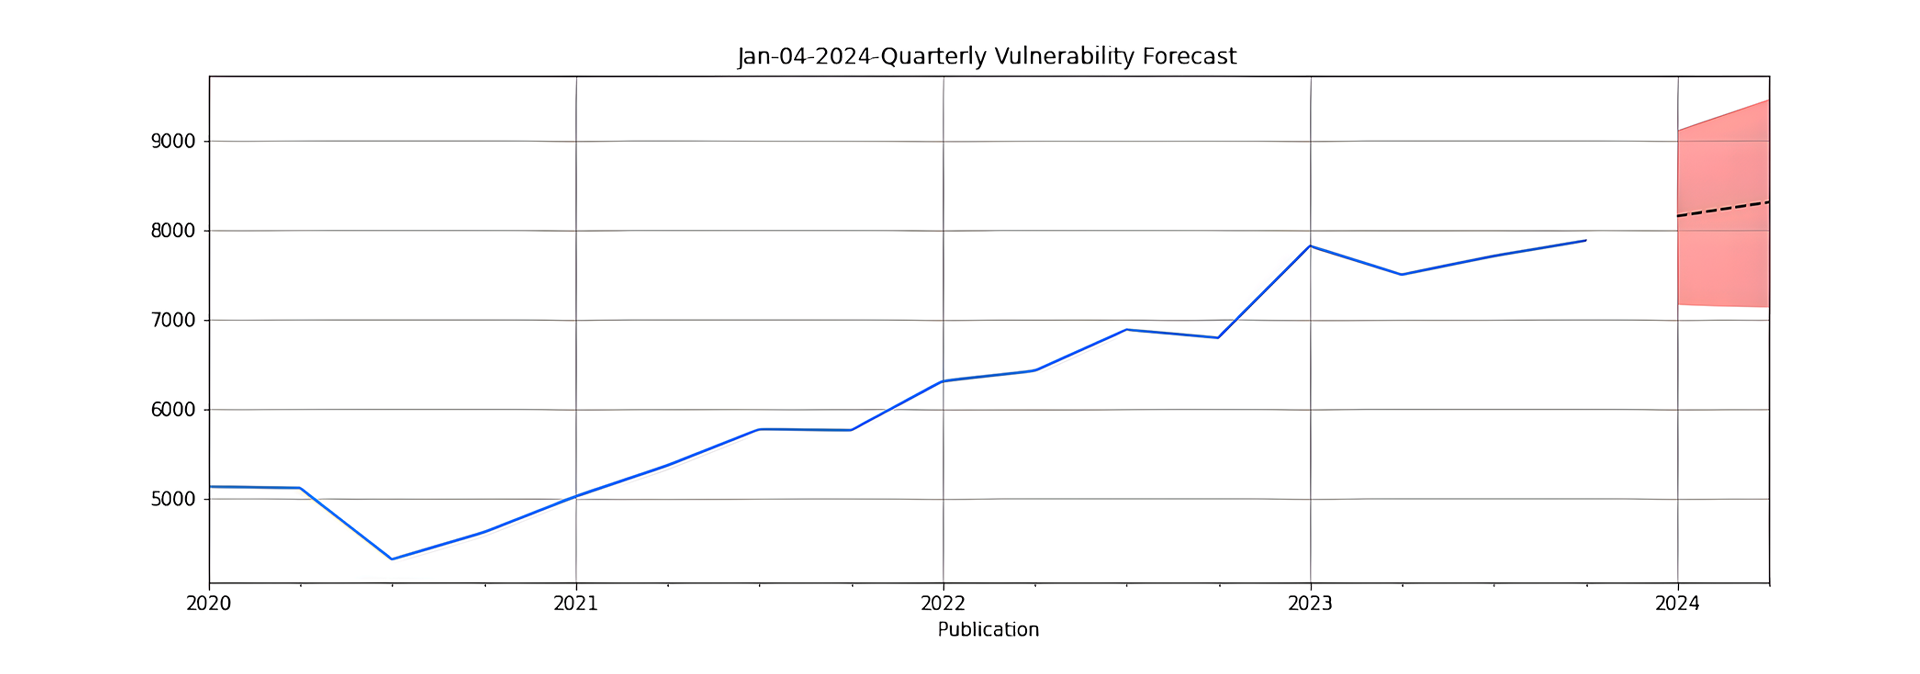
Now, let's get updated and talk about what 2024 Q1 holds for us:
We expect more vulnerabilities in Q1 (perhaps unsurprisingly!), but specifically we expect 8221 +/- 498 vulnerabilities. The dotted line showing that number, and the pink showing our confidence intervals.
Count
mean
mean_se
mean_ci_lower
mean_ci_upper
2024-03-31
8220.673176
498.666524
7243.304749
9198.041602
2024-06-30
8361.310940
579.192494
7226.114512
9496.507368
We hope this helps CERT teams plan their vulnerability notification services, detection engineering, and attack surface management tasks.
We’re still innovating these forecasts though, so we want offer you something more this quarter. Specifically predictions of the top 10 v3 CVSS vectors we will see, alongside how many of them we expect. We think this significantly helps with notification planning, though we can give predictions of more than the top ten if your team needs further information.
This approach is using 3.x CVSS vectors, with the vector below and the number of vulnerabilities we expect to see with that vector next to it.
CVSS Vector
Vulnerabilities
AV:N/AC:L/PR:N/UI:N/S:U/C:H/I:H/A:H
4652
AV:N/AC:L/PR:N/UI:R/S:C/C:L/I:L/A:N
2499
AV:L/AC:L/PR:L/UI:N/S:U/C:H/I:H/A:H
2016
AV:N/AC:L/PR:N/UI:N/S:U/C:N/I:N/A:H
1869
AV:N/AC:L/PR:N/UI:R/S:U/C:H/I:H/A:H
1803
AV:L/AC:L/PR:N/UI:R/S:U/C:H/I:H/A:H
1800
AV:N/AC:L/PR:L/UI:R/S:C/C:L/I:L/A:N
1651
AV:N/AC:L/PR:L/UI:N/S:U/C:H/I:H/A:H
1534
AV:N/AC:L/PR:N/UI:N/S:U/C:H/I:N/A:N
1520
AV:N/AC:L/PR:H/UI:N/S:U/C:H/I:H/A:H
707
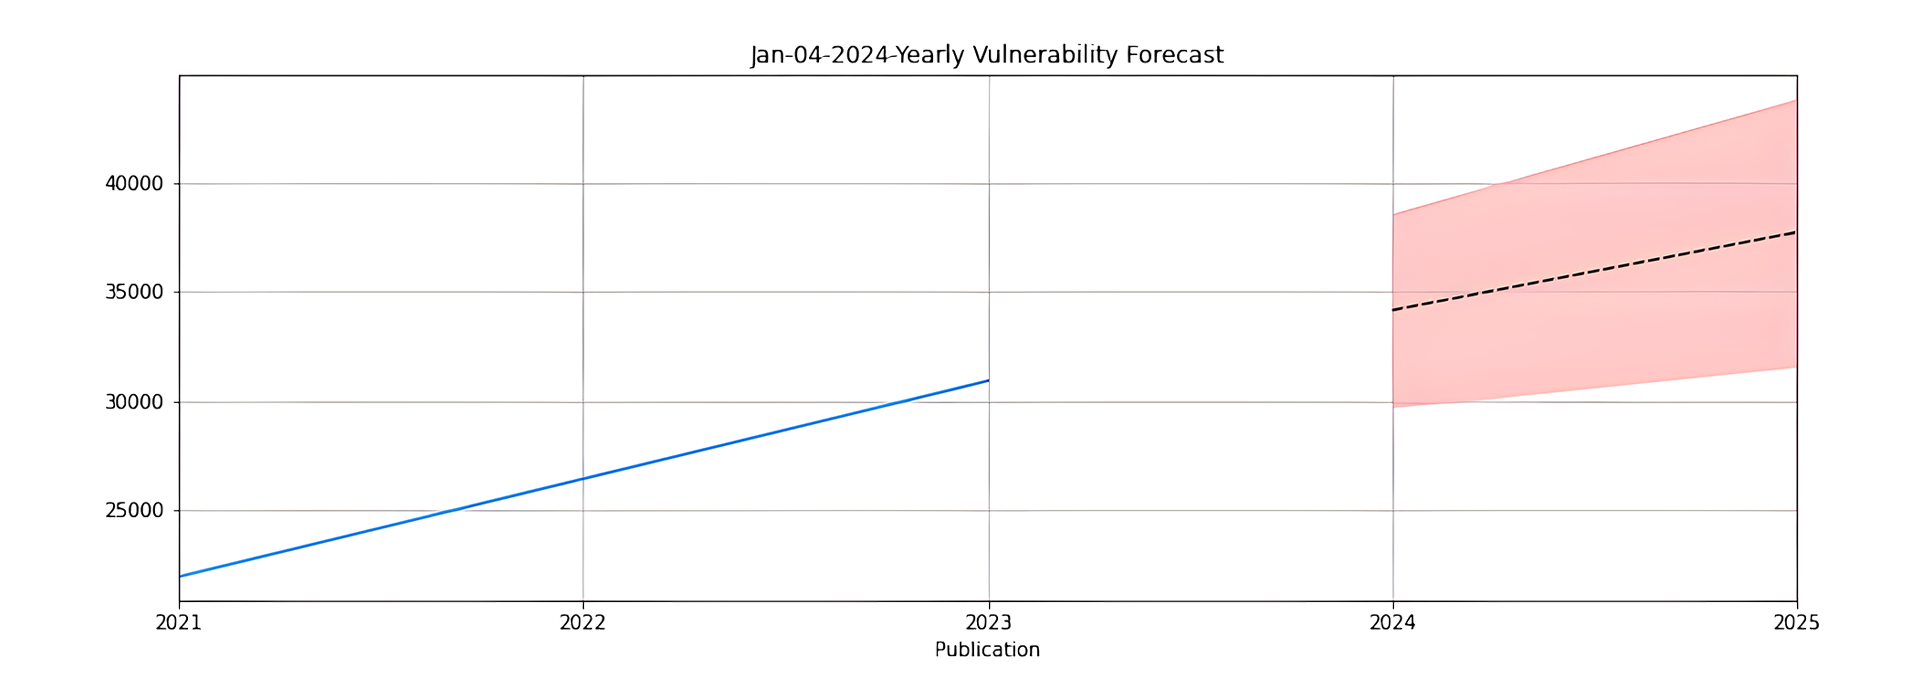
Finally, we come to the yearly forecast. We expect to see 34650 +/- 2074 vulnerabilities disclosed by NVD this year. Sticking to the formats we laid out above, here’s what that looks like.
Count
mean
mean_se
mean_ci_lower
mean_ci_upper
2024-12-31
34650.251324
2074.98593
30583.353632
38717.149015
2025-12-31
38636.971011
2973.22445
32809.558170
44464.383852
We hope your attack surface management teams are ready for that growth, and that you have budgeted or adjusted your vulnerability risk tolerances accordingly. We hope this forecast helps you and your teams plan the quarter and year ahead. May all your serious vulnerabilities get patched and we wish you a prosperous and happy 2024!
Next year we’ll revisit this forecast, and make the next one. We hope to start forecasting other vulnerability disclosure databases or exploit bug bounties soon, and if this interests you can join the vuln4cast mailing list.
The Vulnerability Forecast 2024 CSV archive is available here
FIRST runs a blog open to members and invited guest authors. It publishes contributions relevant to incident responders. Articles should focus on general topics interesting to members. It will not be used to promote individual organisations, products or services. If you are interested in contributing, please get in touch with first-blog@first.org.
Learn more about the Forum of Incident Response and Security Teams through regular blog posts about our organization, events and other programs. Questions or comments? Contact first-press@first.org.