Using EPSS
What EPSS measures
The EPSS score is a calibrated probability: the estimated likelihood that exploitation activity for a given vulnerability will be observed across EPSS data partners in the next 30 days. Not a "severity" score and not a complete risk score. A probability with testable, empirical meaning.
EPSS in common risk frameworks
Every risk analysis, in any field, comes down to two questions: how likely is something to happen, and what happens if it does. Kaplan and Garrick formalized this in 1981 as the foundation of quantitative risk analysis, and it still anchors ISO 31000, one of the leading standards for risk management today. Insurance actuaries, nuclear safety engineers, financial risk managers, and clinicians all work the same two questions, just with different terminology and different approaches to measure each side.
Both sides are hard to measure well. Consequence/impact depends on context specific to your environment, your assets, and the chain of events that follows an initial compromise. Likelihood depends on data about what actually happens in the world, not just what could happen.
Most vulnerability management programs don't run a formal risk framework. That's fine. Every program, formal or not, is aiming at the same target: some estimate of how likely a vulnerability is to be exploited, weighed against some sense of what it would cost if it were. The table below isn't here to suggest you should adopt FAIR or PASTA or any of the others. It's here to show that EPSS measures something direct and tangible in the common approaches to communicating risk, whether or not you're using any of them.
| Framework |
Term EPSS informs |
Notes |
| FAIR (Factor Analysis of Information Risk) |
Threat Event Frequency (TEF) |
FAIR separates Threat Event Frequency (frequency of attacker action) from Vulnerability (probability that action succeeds given resistance strength), combining both into Loss Event Frequency. EPSS approximates TEF at the vulnerability level — it measures observed attacker action, not your control strength. |
| NIST SP 800-30 |
Likelihood determination (component input) |
SP 800-30 defines a single "likelihood" rating that blends adversarial threat capability/intent with target susceptibility and existing controls. EPSS informs the attacker-activity half of that judgment; it does not account for your organization's controls or susceptibility, which SP 800-30 requires as the other half. |
| NIST CSF 2.0 |
Likelihood (ID.RA-04, ID.RA-05) |
CSF 2.0 explicitly names likelihood as an input to vulnerability risk-response prioritization: ID.RA-04 requires likelihoods of threats exploiting vulnerabilities to be identified and recorded; ID.RA-05 requires that likelihood inform prioritization. CSF 2.0 defers its own likelihood methodology to SP 800-30. EPSS provides the attacker-activity input to that likelihood estimate. |
| ISO 27005:2022 |
Threat likelihood |
ISO 27005 separates threat likelihood (motivation, capability, opportunity) from vulnerability exploitability as distinct inputs to risk analysis. EPSS informs the threat likelihood component — observed exploitation activity — not vulnerability exploitability, which the standard treats as a separate technical assessment. |
| PASTA (Process for Attack Simulation and Threat Analysis) |
Threat likelihood (Stage IV, "Analyze the Threats") |
PASTA separates threat analysis (Stage IV, attacker-side: probable attack scenarios, threat intelligence) from vulnerability analysis (Stage V, CVE/CVSS scoring), combining them in attack modeling (Stage VI) and risk/impact analysis (Stage VII, likelihood × impact). EPSS is a direct input to Stage IV; PASTA has no single named likelihood coefficient. |
| OWASP Risk Rating Methodology |
Likelihood (Threat Agent Factors) |
OWASP calculates Likelihood as an average of Threat Agent Factors (skill, motive, opportunity, population size) and Vulnerability Factors (ease of discovery, ease of exploit, awareness, intrusion detection) — expert-assigned ordinal scores. EPSS informs the Threat Agent Factors component; it does not inform ease-of-discovery or awareness, which OWASP treats as separate judgment calls. |
| OCTAVE (Operationally Critical Threat, Asset, and Vulnerability Evaluation) |
Probability (Allegro, Worksheet 10) |
OCTAVE Allegro's threat scenario worksheet includes a Probability field ("What is the likelihood that this threat scenario could occur?"), bundled with Actor/Means/Motive rather than separated into attacker-pressure and target-resistance components. OCTAVE's own guidance leaves inclusion of probability in the risk score to the organization's discretion. EPSS informs that Probability field when an organization chooses to use it. |
The elements in the table above can go on on and on.
Before applying EPSS anywhere in a risk-based decision, it is helpful to understand what it is measuring: a calibrated probability of observed exploitation activity, population-level, updated daily. The table above is reference material for that purpose. Whatever framework you use, formal or not, it points to where EPSS fits and what it does and does not cover once it's there.
Aggregating probabilities across vulnerabilities
Because EPSS produces calibrated probabilities, individual scores can be combined to answer program-level questions that single-vulnerability triage cannot address.
Probability that at least one vulnerability in a set will be exploited
Assuming exploitation events are approximately independent across vulnerabilities, the probability that at least one of n vulnerabilities is exploited is:
1 - ∏(1 - p)
where p is the EPSS score for each individual vulnerability, (1 - p) is the probability that vulnerability is not exploited in the next 30 days, ∏(1 - p) multiplies those together to estimate the probability that none of them are exploited (the ∏ symbol is "product", meaning multiplication), and 1 minus that result gives the probability that at least one event occurs.
For a set of 100 vulnerabilities each scoring 0.05, the probability that at least one is exploited in 30 days is approximately 99.4%. This makes EPSS useful not just for individual prioritization decisions but for program-level exposure quantification.
Expected count of exploited vulnerabilities
The expected number of exploited vulnerabilities in a set over the next 30 days is the sum of the individual probabilities. For 100 vulnerabilities each scoring 0.05, the expected count is 5. This measure is useful for tracking exposure trends over time: as the vulnerability population in your environment changes, the expected exploitation count changes with it.
Both aggregations depend on calibration holding at the portfolio level. They should be treated as estimates, not precise forecasts, and interpreted alongside the coverage/effort/efficiency framework rather than in isolation.
Choosing a threshold
Every threshold decision starts from the same tradeoff. A lower threshold catches more of what eventually gets exploited, at the increased cost of remediating more vulnerabilities. A higher threshold remediates fewer vulnerabilities but misses more of what turns out to matter. This is the coverage/effort tradeoff, and it is the natural starting point for anyone setting a threshold for the first time. Unfortunately, how to set a threshold (or multiple thresholds) is a very localized effort and may be best achieved through trial and updating over time.
As the previous section highlighted, EPSS is a probability and it's best used as a continuous variable in models and calculations. But many security practitioners operate by creating one or more thresholds to create collections of vulnerabilities to treat equally. Before any threshold is set, it's helpful to understand how vulnerabilities actually fall across the range of possible scores.
In any given 30 day period, we are tracking anywhere from 1.5% to 3% of published vulnerabilities with exploitation activity. If that's all we knew, the model would assign each vulnerability a probability that equals the base rate. But since we know more scores cover the entire range, but the mean EPSS score is around 2.8% and the median is around 0.7%. This is important to understand because working with long-tailed distributions is generally counter-intuitive for most. It's easy (but wrong) to see a probability that goes from 0 to 100% and assume since something like 90-100% is a good grade in school, that should be all of the critical ones. While accurate, it selects just 1/5th of the top 1% (the top 0.2%) of all scored vulnerabilities. Another example, you may think that a threshold at 50% is sane, but it's not (since the base rate is around 2%), and setting a threshold at 50% deprioritizes the 98.8% of all published vulnerabilities.
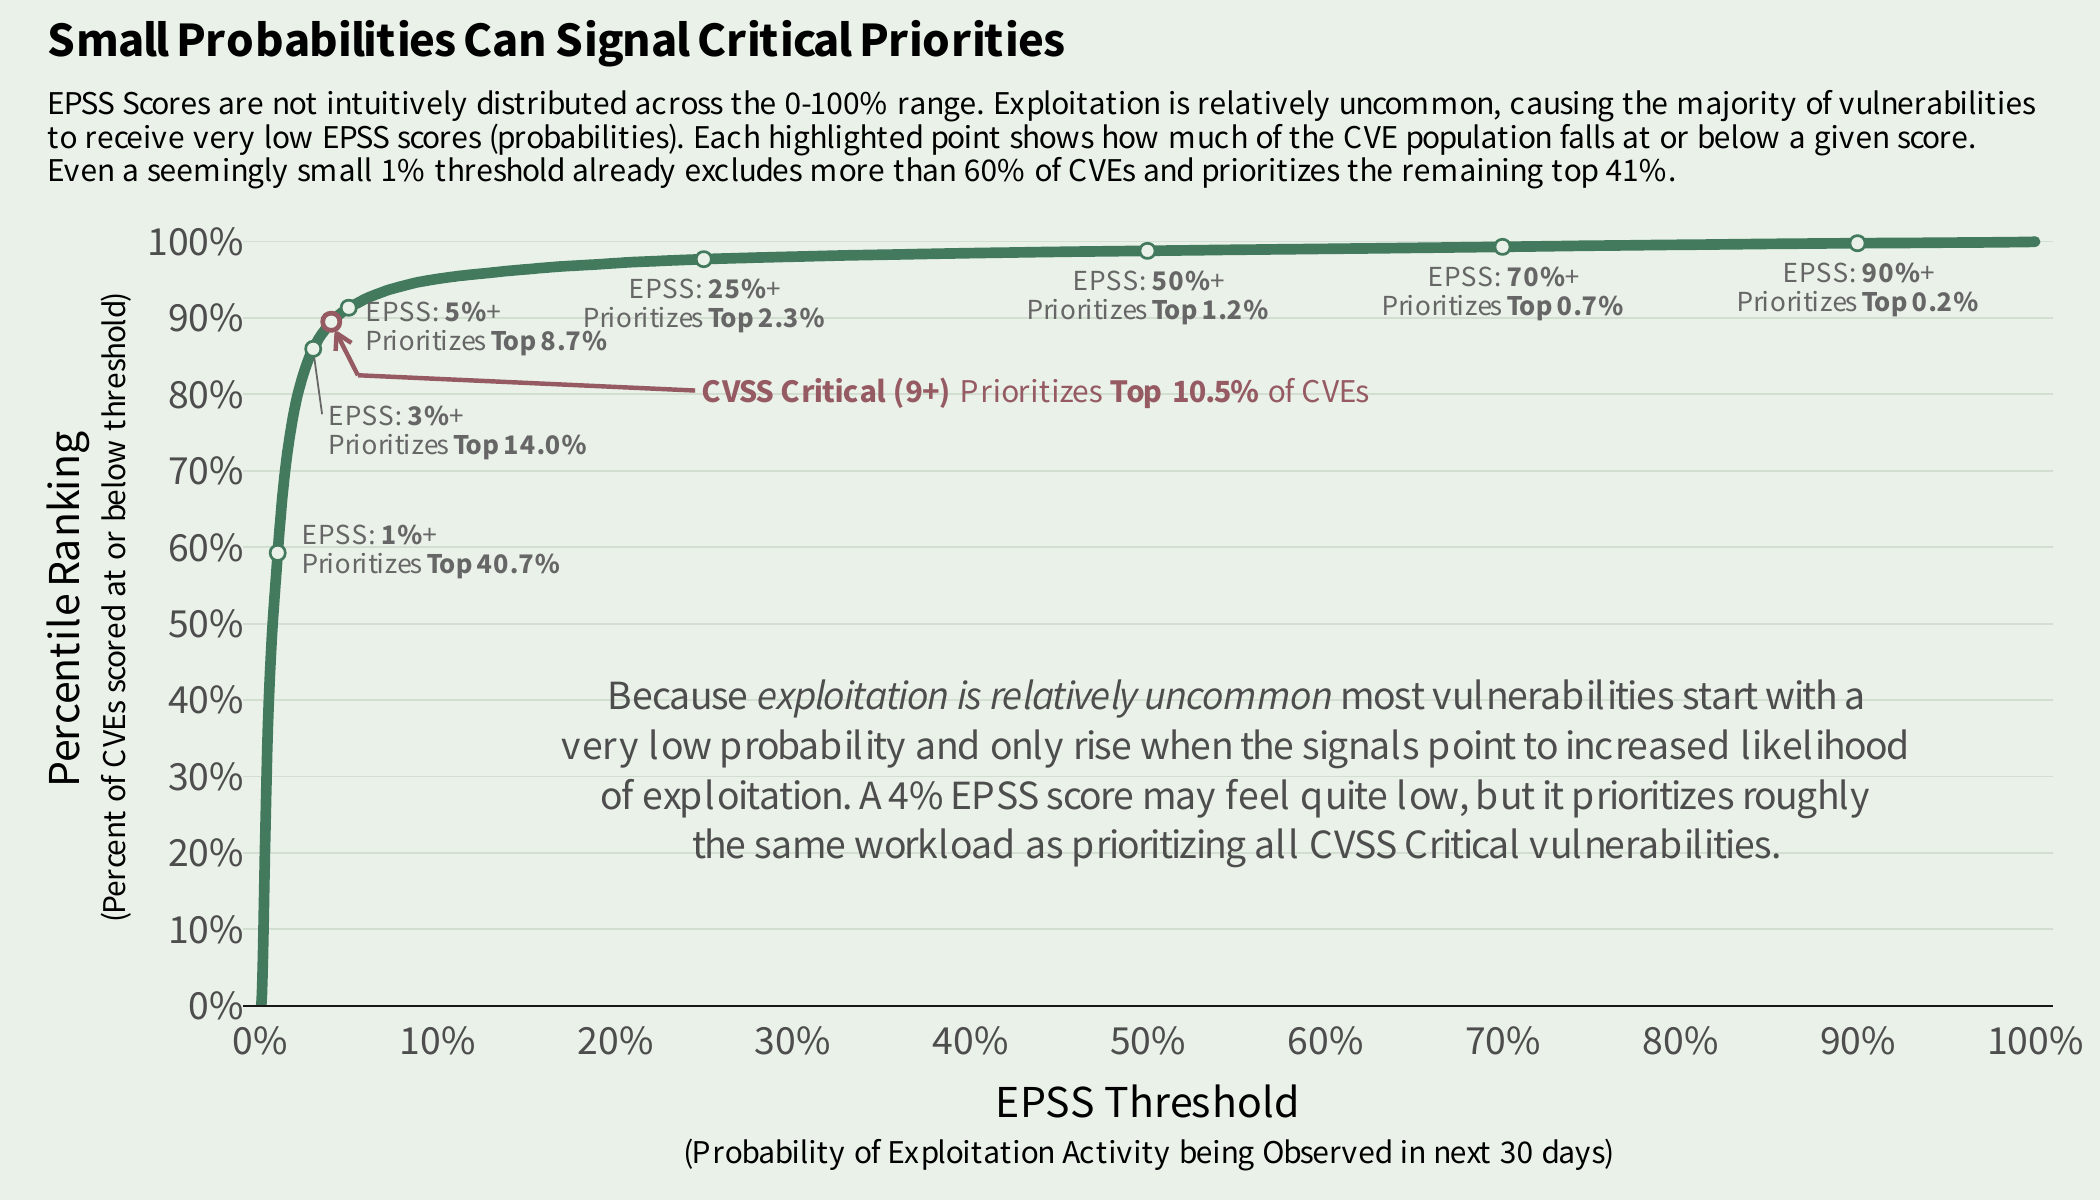
If your program currently treats CVSS Critical as the action threshold, the EPSS equivalent effort level is approximately the 90th percentile (≥0.04, or a 4% probability of exploitation). Over the last 12 months there were about 61,000 CVEs published, and just over 10% received a CVSS Critical rating — so remediating at the 90th EPSS percentile produces roughly the same population size as a CVSS Critical filter, while selecting for the vulnerabilities the threat data actually supports. If your program currently acts on CVSS High and above (approximately the top 48% of published vulnerabilities), the equivalent EPSS threshold is around 0.008 (0.8% probability of exploitation). These translations are a starting point for programs migrating from a CVSS-anchored workflow, not an endorsement of the underlying CVSS categories.
Combining EPSS with other signals
EPSS reflects exploitation probability across the global observed population. That is a strength: the estimate draws on an enormous number of vulnerabilities and events. It is also a limitation: EPSS does not know what is in your environment, whether an attacker could reach it, or whether it is already confirmed to be under attack. Converting a population-level score into an environment-specific decision means combining it with signals that answer those questions.
Localizing the score: presence, reachability, consequence
Three checks convert a population-level EPSS score into something specific to your organization.
Presence. A high EPSS score on a vulnerability you do not have does not matter. Cross-reference EPSS scores against the vulnerabilities discovered in your environment before acting on any of them.
Reachability. A vulnerability present in your environment is only exploitable if the conditions for exploitation exist and are achievable by an attacker. Network exposure, authentication requirements, and compensating controls already in place all determine whether a high population-level score translates into real exposure for you.
Consequence. Exploitation of a vulnerability on critical infrastructure, on a system handling sensitive data, or on a well-connected asset carries different weight than the same vulnerability on a low-value, isolated system. Impact context determines how much the exploitation probability actually matters.
The intersection of a high EPSS score with confirmed presence, confirmed reachability, and high consequence is where remediation effort produces the most risk reduction. Any one of the three being absent, not present, not reachable, low consequence, reduces the urgency regardless of the EPSS score itself.
Combining with confirmed exploitation: CISA KEV
CISA KEV and EPSS answer different questions. KEV lists vulnerabilities with confirmed exploitation: each entry is a report that exploitation occurred at some point in the past. EPSS is a forward-looking probability estimate for the next 30 days. One is a record of history. The other is a forecast.
A low EPSS score on a KEV-listed vulnerability is not a contradiction. KEV confirmation means exploitation occurred. A low EPSS score means the vulnerability's current signal profile resembles vulnerabilities that are rarely exploited at the population level. Both can be true at once: KEV may be recording an isolated incident rather than sustained, widespread activity, and EPSS reflects the broader signal picture across all data partners.
Recent confirmed exploitation is a strong signal on its own. Research shows that recent exploitation activity is a strong indicator of continued near-term exploitation, so a recent KEV addition is reasonable grounds to treat a vulnerability as high priority regardless of its EPSS score. That signal degrades over time. Without other evidence of ongoing exploitation, a vulnerability added to KEV years ago reverts toward the exploitation probability its current features would otherwise predict.
As a general rule of thumb: when a vulnerability appears on CISA KEV, treat it as actively exploited and prioritize accordingly, regardless of EPSS score. EPSS remains useful for everything KEV does not cover, which is the large majority of the vulnerability population at any given time.
Common misuses, misapplications, and misunderstandings
There are quite a few...
- Perfect is the enemy of good. Judging EPSS against an unattainable standard of perfection rather than against the realistic alternatives available. Every prioritization approach (EPSS, CVSS thresholds, KEV-only, "patch vendor criticals") produces both false positives and false negatives. There is no perfect. The question that matters is which approach is the most helpful and least wrong, nobody can wait for an approach to be flawless.(Read more.)
- Applying illegitimate statistics (a.k.a. "Score Laundering"). Do not multiply an EPSS score by an ordinal (such as CVSS) and think that produces a combined "risk score." EPSS is a calibrated probability; CVSS scores are an ordinal ranking with no empirical calibration. The product has no interpretable meaning and does not represent the combination of the two systems. (Read more.)
- Thinking small probabilities are safe. Treating a low EPSS score as a declaration that a vulnerability is safe to ignore. A 5% score across a population of thousands still corresponds to a substantial number of exploitation events since we should expect 1 in every 20 will have observed exploitation activity. (Read more.)
- Judgment from a small sample Do not judging EPSS (or any model) by a single vulnerability's score. One data point (or any small sample) says nothing about a system scoring hundreds of thousands of vulnerabilities daily. It's always best to look at the entire system compared to alternatives. (Read more.)
- Treating different signals as competing. A confirmed exploitation report and a low probability from EPSS are not automatically contradictory, but they aren't automatically reconcilable either. A low score on an exploited vulnerability means the signal profile genuinely resembled low-risk vulnerabilities right up until the event. Confirmed and recent exploitation evidence should take precedence over the score when it exists.
- The score is not about your environment. Acting on a population-level score without checking presence, reachability, and consequence in your own environment. EPSS has no visibility into your asset inventory or compensating controls and, in a mature program, will be one part of any decision.
- The score isn't a live feed of attacks. Expecting a recent, confirmed exploitation event to immediately move the score. Exploitation activity is used to train the model but is not used in the daily scoring. Score movement reflects new threat-intelligence signals and not a lookup of yesterday's headlines.
- Pick threshold that feels right. Anchoring a threshold by intuition (e.g. incorrectly thinking "over 50% should be the top half") can lead to extremely unrealistic thresholds. The base rate of exploitation is roughly 2–3% and the top half is published vulnerabilities with an EPSS score above (approximately) 0.7% right now. This is why every score is published with a percentile ranking: it represents the percent of vulnerabilities at or below this score (e.g. percentile of 0.5 is around 0.007 right now). (Read more or more)
- "I just don't trust predictions" Do not reject EPSS because it's labeled as "prediction" or using confusing or obfuscated techniques. Every other fixed rule like "patch all KEV" or "patch all CVSS Critical" is making a predictive claim about future exploitation. EPSS just states its claim explicitly and measures it. (Read more.)
EPSS is maintained by the EPSS Special Interest Group at FIRST. Scores are generated by Empirical Security and published freely to the community.