Metrics for the Computer Security Incident Response Team (CSIRT) Services Framework
Version 1.1 – May 2026
Also available in PDF
CSIRT Services Framework with Metrics
1 Introduction
The CSIRT Services Framework Metrics document is designed to complement the FIRST CSIRT Services Framework v2.1, a widely adopted reference model that defines the services, functions, and activities commonly performed by Computer Security Incident Response Teams (CSIRTs). The FIRST Framework provides a structured, technology-agnostic description of CSIRT service capabilities but does not prescribe how to measure the performance, effectiveness, or operational quality of those services.
This metrics document, created by the FIRST Metrics SIG, fills that gap. It provides a practical, structured set of quantitative and qualitative metrics that organisations can use to assess, track, and improve the services described in the FIRST Framework. The metrics do not alter or reinterpret the underlying framework; instead, they build upon it by introducing measurable indicators aligned directly to each service function. In each case, the goal is to define metrics that are meaningful, practical, and straightforward to understand.
Because organisations vary widely in mission, maturity, tooling, and resourcing, the metrics in this document are intended to be adaptable rather than prescriptive. Each metric includes a description, type, required data, and suggested measures; however, organisations may tailor the metrics, adjust thresholds, or apply alternative statistical methods as appropriate for their environment.
This document is intended to be used alongside the FIRST CSIRT Services Framework. Used together, the two documents provide a comprehensive approach to understanding, managing, and improving CSIRT operations: the Framework describes what a CSIRT does, and this document supports measuring how effectively those services are delivered.
Note:
This initial version of the Metrics for the CSIRT Services Framework reflects current practitioner experience and the varying maturity of CSIRT operations, which may result in differences in depth or presentation across service areas. Future revisions are expected to further normalize structure, terminology, and level of detail based on community feedback and practical use.
We welcome comments and feedback.
Please direct your email to framework-metrics[@]first.org.
2 Structure
To maintain clarity and interoperability, this document follows the same hierarchical structure as the FIRST Framework. Each metric is labelled using the corresponding section numbering (for example, 5.1.1.1 indicates the first metric for function 5.1.1). This cross-referencing makes it possible to use both documents together: the Framework provides the conceptual model, while this metrics document provides the means to evaluate how well that model is being executed in practice. In some cases, we have used x.0.0.x for metrics at the service area, not functional, level.
Note that the high-level section numbering omits Sections 3 and 4. This is by design, to ensure correlation with the CSIRT Services Framework, where Service Area numbering starts at Section 5.
2.1 Key Elements in the CSIRT Services Framework
The framework for CSIRT services is based on the relationships of these key elements:
SERVICE AREAS – SERVICES – FUNCTIONS
These elements are defined as:
SERVICE AREAS
Service areas group services related to a common aspect. They help to organize the services along a top-level categorization to facilitate understanding and communication.
SERVICES
A service is a set of recognizable, coherent functions oriented towards a specific result. Such results may be expected or required by constituents or on behalf of or for the stakeholder of an entity.
FUNCTIONS
A function is an activity or set of activities aimed at fulfilling the purpose of a particular service.
2.2 Additional Element in this Metrics Document
This document includes an additional element – Metrics – resulting in:
SERVICE AREAS – SERVICES – FUNCTIONS – METRICS
Each defined metric relates specifically to its function in the CSIRT Service Framework.
2.3 Conventions
The following conventions apply throughout this document to promote clarity and consistency across all service areas and metrics:
- **Metric titles** use sentence case, with only the first word capitalized.
- **Metric identifiers** follow the numbering of the CSIRT Services Framework (for example, 5.1.1.2) and are used consistently for cross-reference. Additionally, we have defined some Service Area, and Service level metrics, in which cases the number schemes are x.0.0.x and x.0.x.x
- **Data requirements** within each metric are listed as N1, N2, N3, and so on, and this numbering resets for every metric.
- **Data completeness**: All data elements required for understanding or calculating a metric are included within that metric's own data requirements section.
- **Notes section**: Each metric may include optional notes to clarify use cases, interpretation considerations, or implementation boundaries.
- **Metric types**: Each metric identifies a type (for example, _Efficiency_, _Effectiveness_, _Impact_, or _Implementation_). These types are descriptive and not intended to impose analytical constraints.
- **Neutral framing**: Metrics are written to be technology-agnostic and organisationally neutral so that teams can adapt them to their own tooling, workflows, and maturity levels.
2.4 Metrics Table Template
The template below is used as a standard definition for each metric.
| Metric Attribute |
Details |
| Name |
This is the exact name of the metric. It should match the name that is in the section heading. |
| Description |
Provide a detailed description of the metric. How does it relate to the function? What is the intent? Anything that will clarify how this metric is to be used. |
| Type |
_See Section 2.5 for detailed descriptions of the metrics types. |
| Data Required |
Note the specific data points that will be required to calculate this metric. Each individual data point should be a discrete number from which a clear calculation can be made. |
| Calculation |
The formula to be used with the above data points to create the metric. The result should be numeric. |
| Measure |
This should be one of {Percentage, Mean, Median, Number, Ratio} |
| Notes |
Any additional notes that may provide further clarification on this metric. Often this may include comments on the level of effort required for creating this metric. It may include additional insights into why this metric was included, or how to use it. In some cases, we have included sample target ranges. |
2.5 Types of Metrics
We use four types of metrics, directly based on the NIST Measurement Guide for Information Security. These types help ensure the correct focus for each measurement.
Following is the definition of each:
Implementation measures demonstrate the progress of specific controls. Monitoring implementation may include assessment results, such as a tally of known systems or a binary “yes/no” about which systems have up-to-date patches. Implementation measures look at quantitative outputs and are usually demonstrated in percentages.
Effectiveness measures evaluate how well implementation processes and controls are working and whether they are meeting the desired outcome. An effectiveness assessment can either concentrate on the evidence and results of a quantitative analysis of measures or be applied in a qualitative “yes/no” paradigm.
Efficiency measures examine the timeliness of controls by determining the speed at which they give useful feedback, and how quickly those issues are addressed.
Impact measures articulate the impact of information security on an organisation's unique mission, goals, and objectives including change quantification on areas such as business value, cost savings, trust scores, etc.
2.6 Notes on Statistical Analysis Methods
Unless otherwise specified, the metrics in this document do not prescribe the use of a particular statistical method. In cases where no method is indicated, organisations may analyse the resulting values using common approaches such as mean, median, percentile distributions, or other summary statistics that best reflect their operational environment.
Where a specific statistical method is recommended, it should not be viewed as restrictive. Raw values may still be trended over time, and alternative statistical techniques may be applied when they provide clearer insight or greater analytical value.
Note:
Top level numbering now skips to Section 5 to maintain correlation with the CSIRT Services Framework
5.1 Service: Monitoring and detection
5.1.1 Function: Log and sensor management
Metrics: The following metrics are defined for this function:
- Sensor / source availability
- Sensor / source criticality definition
5.1.1.1 Metric: Sensor / source availability
| Metric Attribute |
Details |
| Name |
Sensor / source availability |
| Description |
This metric is designed to help ensure that sensors are appropriately available for generating and reporting security events. Without monitoring availability, it is difficult or impossible to assure that your SIEM has a complete data set, which is critical for monitoring and investigations. |
| Type |
Effectiveness |
| Data Required |
(N1) Binary indicators of individual sensors' availability, measured over discrete time intervals, e.g. every 5 minutes
This number can be gathered in a variety of manners; try to pick a method that most likely guarantees data is being transmitted appropriately.
(N2) Number of reporting intervals (may be user selected) |
| Calculation |
(N1) / (N2) * 100 |
| Measure |
Percentage |
| Notes |
Possible availability targets:
- Fully available (e.g., 24x7)
- Expected Available (e.g., 8x5 or as planned)
Exclude planned outages per log source type, per criticality.
Organisations might have different sensor availability requirements for different periods (like operations peaks, non-working hours). Then a few sensors' availability metrics can be measured for the same sensor. |
5.1.1.2 Metric: Sensor / source criticality definition
| Metric Attribute |
Details |
| Name |
Sensor / source criticality definition |
| Description |
To manage sensor availability and outage response time, a criticality definition should be defined for each sensor. The criticality levels can be defined in any manner to suit your business (e.g., P1, P2, P3 vs. high, medium, low.) The important idea here is that the criticality labels are applied across the full distribution environment. |
| Type |
Implementation |
| Data Required |
(N1) Number of sensors
(N2) Number of sensors with criticality level defined |
| Calculation |
N2 / N1 * 100 |
| Measure |
Percentage |
| Notes |
5.1.2 Function: Detection use case management
Metrics: The following metrics are defined for this function:
- Detection coverage against threat TTPs
- Instruction coverage against number of detection use cases
- False positives ratio per detection use case
5.1.2.1 Metric: Detection coverage against threat TTPs
| Metric Attribute |
Details |
| Name |
Detection coverage against threat TTPs |
| Description |
By measuring detection use case coverage against TTPs of threats you have determined to be relevant in a risk-oriented way, it is possible to measure how well your use cases are performing against those TTPs derived from your threat assessment. |
| Type |
Effectiveness |
| Data Required |
(N1) Count of TTPs relevant for your organisation
(N2) Count of your detection use cases mapped to corresponding TTPs |
| Calculations |
N2 / N1 * 100 |
| Measure(s) |
Percentage |
| Notes |
We recommend using the MITRE ATT&CK framework for your threat assessment.
We recommend adding and taking into consideration a criticality definition on the TTP matrix to help analyse where to apply resources. |
5.1.2.2 Metric: Instruction coverage against number of detection use cases
| Metric Attribute |
Details |
| Name |
Instruction coverage against number of detection use cases |
| Description |
This metric indicates how well your detection coverage is organized, by counting how many of your detection use cases have instructions for analysts defined. |
| Type |
Implementation |
| Data Required |
(N1) Number of detection use cases
(N2) Number of detection use cases with instructions |
| Calculations |
N2 / N1 * 100 |
| Measure |
Percentage |
| Notes |
Having identifiers for your detection use cases corresponding with identifiers for your instructions will help. |
5.1.2.3 Metric: False positive ratios per detection use case
| Metric Attribute |
Details |
| Name |
False positive ratios per detection use case |
| Description |
The ratios of false positives within detection use cases can help identify those use cases that may benefit from tuning. This metric provides two ratios – one against all verdicts, and one against only true positive verdicts |
| Type |
Effectiveness |
| Data Required |
For each detection use case:
(N1) total number of events
(N2) total number of events with True Positive verdict
(N3) total number of events with False Positive verdict |
| Calculations |
N3 / N1 * 100
This is the percentage of false positives for all detections
N3 / N2 * 100
This is the ratio of false positive to true positives |
| Measure |
Percentage
Ratio |
| Notes |
5.1.3 Function: Contextual data management
Metrics: The following metric is defined for this function:
- Quality of contextual data
5.1.3.1 Metric: Quality of contextual data
| Metric Attribute |
Details |
| Name |
Quality of contextual data |
| Description |
Quality defined by percentage of incorrect information received from the external sources providing contextual information.
We measure this by counting the number of errors received for the queries launched. These errors can be due to different causes, for example, source unavailability, allowed query limit exceeded, or detected mistakes. |
| Type |
Effectiveness |
| Data Required |
(N1) Number of queries for context
(N2) Number of errors |
| Calculations |
N2 / N1 * 100 |
| Measure |
Percentage |
| Notes |
Determining incorrectness (number of errors) can be difficult and likely to occur downstream from contextual data use |
5.2 Service: Event analysis
5.2.1 Function: Correlation
Metrics: The following metric is defined for this function:
- Mean manual alert correlation
5.2.1.1 Metric: Mean manual alert correlation
| Metric Attribute |
Details |
| Name |
Mean manual alert correlation |
| Description |
The goal of this metric is to evaluate the efficiency of our alert correlation capabilities, to support efficient event analysis.
To measure this, we examine how many alerts require manual correlation for each incident. This indicates the number of correlations that are missed pre-triage. |
| Type |
Efficiency |
| Data Required |
(N1) Number of alerts manually correlated with each incident (manual duplicates) |
| Calculation |
Calculate manual alert correlation level (CL) for each incident as 1 / N1 (pct)
Calculate the mean of the CL (mCL). |
| Measure |
Mean |
| Notes |
Higher mCL is better |
5.2.2 Function: Qualification
Metrics: The following metrics are defined for this function:
- Completeness of qualification documentation for alerts triage
- Time to acknowledge alerts and incident reports
- Ratio of true-positives to false-positives
- Time to detect incident
5.2.2.1 Metric: Completeness of qualification documentation for alerts triage
| Metric Attribute |
Details |
| Name |
Completeness of qualification documentation for alert triage |
| Description |
Each qualification should have documentation explaining the verdict choice. |
| Type |
Implementation |
| Data Required |
(N1) Number of alerts triaged
(N2) Number of alerts with qualification documentation |
| Calculation |
N2 / N1 * 100 |
| Measure |
Percentage |
| Notes |
Will likely need to gather the data required via sampling. |
5.2.2.2 Metric: Time to acknowledge alerts and incident reports
| Metric Attribute |
Details |
| Name |
Time to acknowledge alerts and incident reports |
| Description |
Consistent reaction times to alerts within risk appetite is an indicator to investigate how well the analysts doing the job are equipped and staffed to handle the job expected of them by the organisation. Also, alerts urgency can be a significant factor in the success of your mission. |
| Type |
Implementation |
| Data Required |
(N1) Time at which the alert report is raised
(N2) Time at which the report is acknowledged and analysis is started, either by human or machine |
| Calculation |
N2 - N1 (time to acknowledge) |
| Measure |
Number |
| Notes |
It is highly recommended to have timings of alert creation and acknowledgement recording by machine or system.
You will want to analyse the collection of Time to Acknowledge values across a time slice.
You may want to analyse per alert type, analyst, or another attribute. |
5.2.2.3 Metric: Ratio of true-positives to false-positives
| Metric Attribute |
Details |
| Name |
Ratio of true-positives to false-positives |
| Description |
Measured at the closure of the alerts, True-positives versus False-positives ratio |
| Type |
Effectiveness |
| Data Required |
(N1) Count of true-positive alerts
(N2) Count of false-positive alert |
| Calculation |
N1 / N2 |
| Measure |
Ratio |
| Notes |
The higher ratio is the more effective ("producing a result that is wanted") detection rules are inspired by reading Threat detection metrics: exploring the true-positive spectrum - by Alex Teixeira.
One noted difficulty is ensuring that we have a clear definition and timely marking of what is false-positive and true-positive. |
5.2.2.4 Metric: Time to detect
| Metric Attribute |
Details |
| Name |
Time to detect |
| Description |
Indicates how fast incident detection toolset generates alert or incident from processed log sources |
| Type |
Efficiency |
| Data Required |
(N1) The time at which the event itself first occurred
(N2) The time at which the event was detected |
| Calculation |
N2 - N1 |
| Measure |
Number |
| Notes |
Evaluate this metric to generate statistical analyses over time and type.
Note that not all log sources are consolidated instantly, but rather a pulling method is used, focusing on such a metric requires understanding the impact of more frequent polling.
Refer to Security Incident Timing Metrics on the FIRST Portal. |
Metrics: The following metrics are defined for this function:
- Time to acknowledge incident reports
- Percentage of acknowledged reports
6.1.1.1 Metric: Time to acknowledge incident report receipt
| Metric Attribute |
Details |
| Name |
Time to acknowledge incident report receipt |
| Description |
Measuring reaction times to incident reports can be used to investigate how well the analysts doing the job are equipped and staffed to handle the job expected of them by the organisation. Also, for some alerts urgency can be a significant factor in the success of your mission. |
| Type |
Efficiency |
| Data Required |
(N1) Time at which the initial incident report was received
(N2) Time at which acknowledgement of that receipt was sent |
| Calculation |
N2 - N1 |
| Measure |
Number |
| Notes |
Evaluate this metric to generate statistical analyses such as median over time and type of incident. |
6.1.1.2 Metric: Percentage of reports that are acknowledged
| Metric Attribute |
Details |
| Name |
Percentage of reports that are acknowledged |
| Description |
This is an easy metric to track report acknowledgement, ensuring processes can be evaluated to avoid having reports fall through the cracks. |
| Type |
Effectiveness |
| Data Required |
(N1) Number of reports
(N2) Number of reports acknowledged |
| Calculation |
N2 / N1 * 100 |
| Measure |
Percentage |
| Notes |
Metrics: The following metrics are defined for this function:
- Percentage of quality issues in triage instances
- Time from incident receipt to triage completion
6.1.2.1 Metric: Time from incident receipt to triage completion
| Metric Attribute |
Details |
| Name |
Time from incident receipt to triage completion |
| Description |
This metric can be used to track the amount of time involved in triage activities. By tracking triage durations you can spot trends, compare entities, and analyse your data for efficiency improvements. We caution against setting targets for triage completion due to the risk of negative impact on quality. |
| Type |
Effectiveness |
| Data Required |
(N1) The point in time when the security event is available for triage
(N2) The point in time when the triage is completed |
| Calculation |
N2 - N1 |
| Measure |
Number |
| Notes |
This metric will be most useful when analysed across a variety of attributes such as event report source or analyst team.
You can also use receipt acknowledgement as the starting point for this metric if it is more appropriate for your organisation.
Refer to Security Incident Timing Metrics on the FIRST Portal |
6.1.2.2 Metric: Percentage of quality issues in triage instances
| Metric Attribute |
Details |
| Name |
Percentage of quality issues in triage instances |
| Description |
Like section 5.2.2, this function includes triaging activity during which verdict, categorization, and prioritization may be assigned.
Use this metric to evaluate the quality of this function’s output, with the intent of improving functional processes as needed. |
| Type |
Implementation |
| Data Required |
(N1) Number of potential security incidents evaluated
(N2) Number of errors in triage processing |
| Calculation |
(N2 / N1) * 100 |
| Measure |
Percentage |
| Notes |
Shows quality - if the rate is above the set target threshold determine improvement needed, e.g. additional triage training or improved automation.
For simplicity this metrics groups multiple attributes into quality issues. Group or ungroup attributes according to your preference.
“Errors” and “Reported Deficiencies” are alternate terms for quality issues. |
Metrics: The following metrics are defined for this function:
- Error rate of incident triage
- Incidents with altered priority
Note:
Section 6.2.1 implies that an initial assessment of an information security incident might already be included in a previous step. The information may have been provided to the CSIRT via one of the following channels:
- CSIRT communication channels, in which case may or may not have qualification completed. [refer to Section 6.1.1- Information Security Incident Report receipt]
- Internal detection and monitoring capability [refer to Section 5.2.2 - Event Analysis: Qualification]
In the above case, qualification has already been accomplished and metrics from those sections may have already been applied.
If the initial assessment has not been completed, then perform the qualification and apply the metrics 5.2.2.1-4 and 6.2.1.1-2 (where it makes sense).
We have added metrics 6.2.1.1-2 as specific to this section.
6.2.1.1 Metric: Error rate of incident triage
| Metric Attribute |
Details |
| Name |
Error rate of incident triage |
| Description |
Ensure that incidents have been triaged according to the Security Incident Response Policy to improve the quality of the incident triage. |
| Type |
Effectiveness |
| Data Required |
(N1) The number of information security incidents where triage has been performed.
(N2) The number of information security incidents for which a subject matter expert review revealed triage was not done correctly according to policy. |
| Calculation |
(N2) / (N1) * 100 |
| Measure |
Percentage (lower is better) |
| Notes |
This metric expects that there is a process in which a subject matter expert reviews security incidents to validate the effectiveness of incident triage regarding categorization. This may not always be the case.
Risk and compliance environments vary in organisations. You should define what areas of the triage attributes that matters most to you, make it part of your SME review process and consider collecting data for each one to have a more granular understanding of what parts of your triage function are more prone to errors.
Example:
An expert review process collecting data on categorisation and initial prioritization could reveal that triage fails half the time and it is always the initial prioritization and never the categorization that fails, pinpointing where you should put your effort. |
6.2.1.2 Metric: Incidents with altered priority
| Metric Attribute |
Details |
| Name |
Incidents with altered priority |
| Description |
Number of Security Incidents that have their prioritization changed in their lifecycle |
| Type |
Efficiency |
| Data Required |
(N1) Number of security incidents with altered priority |
| Calculation |
N1 |
| Measure |
Number |
| Notes |
It may be difficult to have an accurate history of how many times the priority for an incident may have changed.
Although changes to an incident’s priority during its lifecycle are a valid activity, by analysing the incidents whose priority changed, a team can dig deeper into why this is happening. For example, additional data during triage may help analysts set the priority correctly. |
Metrics: The following metrics are defined for this function:
- Accuracy of information data sources
- Chain of custody compliance
- Completeness of contextual data
| Metric Attribute |
Details |
| Name |
Accuracy of information data sources |
| Description |
Assess the reliability and accuracy of information sources providing data and details regarding the security incident. |
| Type |
Effectiveness |
| Data Required |
(N1) Number of data sources and stores used in your incident
(N2) Number of data sources and stores where data accuracy has been validated |
| Calculation |
N2 / N1 * 100 (percentage) |
| Measure |
Percentage |
| Notes |
It may be difficult to reliably validate data accuracy.
Accuracy of information data sources will need to be measured through validation processes or other feedback mechanisms.
You may need to use sampling for measurements. |
6.2.2.2 Metric: Chain of custody compliance
| Metric Attribute |
Details |
| Name |
Chain of custody compliance |
| Description |
Track the completeness of authenticity and integrity controls for data sources used in your security operation, as they adhere to chain of custody compliance restrictions |
| Type |
Effectiveness |
| Data Required |
(N1) Number of the data sources and stores used in your incident
(N2) Number of data sources and stores where sufficient controls are in place to protect the compliance integrity of the data. |
| Calculation |
N2 / N1 * 100 (percentage) |
| Measure |
Percentage |
| Notes |
You will need to define a baseline for what integrity controls are required for your operation and assess your data sources against integrity control baseline.
You can increase maturity by checking with your local authorities if your integrity controls would be sufficient for the data to be used in evidence in court.
Reference for more details on chain of custody:
https://www.cisa.gov/sites/default/files/publications/cisa-insights_chain-of-custody-and-ci-systems_508.pdf |
6.2.2.3 Metric: Completeness of contextual data
| Metric Attribute |
Details |
| Name |
Completeness of contextual data |
| Description |
This metric will help you have an overview of the volume of incident data your team collected and attached to incidents. |
| Type |
Effectiveness |
| Data Required |
(N1) Total number of incidents
(N2) Total number of incidents with contextual data attached |
| Calculation |
N2 / N1 * 100 |
| Measure |
Percentage |
| Notes |
This metric does not necessarily address the quality of your contextual data, but rather its presence. If observables are referenced in the incident, they should be included with the case. |
6.2.3 Function: Detailed analysis coordination
Metrics: The following metrics are defined for this function:
- Number of unresolved tasks at incident closure
- Time to complete tasks
6.2.3.1 Metric: Unresolved tasks at incident closure
| Metric Attribute |
Details |
| Name |
Unresolved tasks at incident closure |
| Description |
Used as an indicator of potential process failure - where tasks are not being completed by the responsible party. |
| Type |
Effectiveness |
| Data Required |
(N1) Number of tasks attached to the incident
(N2) Number of unresolved tasks at incident closure |
| Calculation |
(N2 / N1) * 100 |
| Measure |
Percentage |
| Notes |
As this metric does not assess the quality of the resolution on tasks, guard against tasks that are resolved simply for the sake of this metric. Consider a QC process using sampling for quality review. |
6.2.3.2 Metric: Time to complete tasks
| Metric Attribute |
Details |
| Name |
Time to complete tasks |
| Description |
Resolution time is a critical component of incident response. Therefore, tasks assigned to incidents should be completed as quickly as possible to avoid negative impact from the incident. Use this metric to assess timeliness. |
| Type |
Efficiency |
| Data Required |
For each task (t):
(N1) Task creation time
(N2) Task completion time |
| Calculation |
Median({t(N2-N1)} ) |
| Measure |
Median |
| Notes |
Timing data should be generated (automatically) from system timestamps.
Mean can be used but your time series will not likely be a normal distribution resulting in outlier impact. Using median may require stakeholder training. Can be paired with percentiles for clarification.
As with 6.2.3.1, this metric does not assess the quality of the resolution on tasks. Guard against tasks that are resolved simply for the sake of this metric. Consider a QC process using sampling for quality review. |
Metrics: The following metrics are defined for this function:
- Time to complete root cause analysis
- Incidents with root cause not identified
- Root cause category analysis
6.2.4.1 Metric: Time to complete root cause analysis
| Metric Attribute |
Details |
| Name |
Time to complete root cause analysis |
| Description |
This metric is used to evaluate time involved in finding the root cause for an incident. By establishing targets or high / low ranges, this metric can be used as a starting point for conducting process analysis to find potential improvements. |
| Type |
Efficiency |
| Data Required |
(N1) Time at which root cause analysis begins
(N2) Time at which root cause analysis is successfully completed |
| Calculation |
N2 - N1 |
| Measure |
Number |
| Notes |
Both the start and end time may be somewhat nebulous but try not to get too caught up in getting the exact moment. The intent of this metric is to help you evaluate efficiency within the process itself.
Because this metric is intended to evaluate and drive efficiency, it should not be used as a KPI.
You will likely want to analyse the trend in categorised incidents over a period as single numbers will be of limited use except when they fall outside established targets. It is also possible to analyse the set using statistical methods, e.g., median. Refer to section 2.6 |
6.2.4.2 Metric: Incidents with root cause not identified
| Metric Attribute |
Details |
| Name |
Incidents with root cause not identified |
| Description |
This metric is designed to help ensure that the root cause of an incident is identified whenever required, thereby helping to reduce the likelihood of future incidents via that same threat vector. |
| Type |
Effectiveness |
| Data Required |
(N1) - total number of incidents
(N2) - number of incidents with root cause not identified |
| Calculation |
(N2) / (N1) * 100 |
| Measure |
Percentage |
| Notes |
Low percentage is better.
Root cause analysis can show how much a CSIRT understands the environment tech stack and the teams responsible for, once, in some cases, will be difficult for a CSIRT to perform this function thoroughly, but will need to know who can support.
This metric does not measure successful root cause resolution as that may often be out of scope for CSIRTs. |
6.2.4.3 Metric: Root cause category analysis
| Metric Attribute |
Details |
| Name |
Root cause category analysis |
| Description |
Count incident root causes according to their categorization.
The intent of this metric is to identify broad areas of impact for attention, e.g. prioritisation, funding, or process improvement. |
| Type |
Impact |
| Data Required |
(N1) - total number of incidents with root cause category assigned
(regardless of value)
(N2) - count of incidents per associated root cause category
(repeated for each category…) |
| Calculation |
N2 / N1 * 100
Repeated for each category |
| Measure |
Percentage |
| Notes |
Identifying root cause in general can be a resource intensive process. We recommend automating this as much as possible starting with your detection use case management (Section 5.1.2).
Examples of root cause category may include phishing, unpatched vulnerability, password hygiene, etc. |
6.2.5 Function: Cross-incident correlation
Metrics: The following metrics are defined for this function:
- Incidents correlated to other incidents
- Incidents with incorrect correlation
| Metric Attribute |
Details |
| Name |
Incidents correlated to other incidents |
| Description |
The metric can be used to evaluate successful use of cross-incident linking via correlation. |
| Type |
Implementation |
| Data Required |
(N1) - total number of incidents handled
(N2) - number of incidents linked to other incidents via correlation |
| Calculation |
N2 / N1 * 100 |
| Measure |
Percentage |
| Notes |
There may be some difficulty in incident correlation but if that is set up properly this metric should be easy to implement.
A relatively large percentage may demonstrate effectiveness in correlating incidents. However, if correlation is set up properly a low value may indicate that most incidents are not related.
This is not a qualitative metric, so the value in this metric will be to analyse trending over time, ensuring incident correlation activity is occurring as expected. |
6.2.5.2 Metric: Incidents with incorrect correlation (correlation error rate)
| Metric Attribute |
Details |
| Name |
Incidents with incorrect correlation |
| Description |
In some cases, linkage between incidents might be caused due to error in correlation - understood when looking at the linked incidents. This metric should be used only when there is a substantial number/percentage of the linkage via correlation - to detect the quality of the correlations and if needed to initiate changes in the correlation engine. |
| Type |
Effectiveness |
| Data Required |
(N1) - Number of incidents correlated to other incidents
(N2) - Number of incidents correlated to other incidents, with an incorrect correlation |
| Calculation |
(N2) / (N1)*100% |
| Measure |
Percentage |
| Notes |
N2 can be understood only when the incident correlation is analysed manually (or by AI) so may be difficult to measure. It may need to be accomplished via sample analysis. |
6.3 Service: Artefact and forensic evidence analysis
Metrics: The following metrics are defined for this function:
- Ratio of identified malicious artefacts to total artefacts
- Ratio of artefacts with inconclusive analysis to total artefacts
- Number of never seen artefacts
- Time to identify key artefact attributes
6.3.1.1 Metric: Ratio of identified malicious artefacts to total artefacts
| Metric Attribute |
Details |
| Name |
Ratio of identified malicious artefacts to total artefacts |
| Description |
This metric identifies the ratio of malicious artefacts to the total number of artefacts discovered after media or surface analysis by the incident response team. |
| Type |
Implementation |
| Data Required |
(N1) Number of total artefacts analysed
(N2) Number of malicious artefacts identified |
| Calculation |
N2 / N1 |
| Measure |
Ratio |
| Notes |
A system for storing historical media/surface analysis data is required. This data stored can be the totals themselves or better, a list of all artefacts with associated conclusions that can be summarized.
A low number for this metric may show wide collection but relatively few are malicious, impacting workload. A high number may indicate strong pre-filtering but also the risk of missing non-obvious artefacts. Time trending can provide additional insights into process changes
The raw numbers of malicious artefacts (N2) can also be useful for trending analysis reflecting a potential need for capacity planning regarding people, infrastructure, or process improvements. |
6.3.1.2 Metric: Ratio of artefacts with inconclusive analysis to total artefacts
| Metric Attribute |
Details |
| Name |
Ratio of artefacts with inconclusive analysis to total artefacts |
| Description |
This metric identifies the ratio of inconclusive artefacts to the total number of artefacts using the number of artefacts whose verdict is inconclusive following media or surface analysis by the incident response team. |
| Type |
Implementation |
| Data Required |
(N1) Number of total artefacts analysed
(N2) (N2) Number of inconclusive artefacts |
| Calculation |
N2 / N1 |
| Measure |
Ratio |
| Notes |
A system for storing historical media/surface analysis data is required. This data stored can be the totals themselves or better, a list of all artefacts with associated conclusions that can be summarized.
A low number for this metric might give indication of process inefficiencies or errors, yielding inconclusive results. A high number may indicate that the team is not gathering enough artefacts for analysis and may be missing potential threats, indicating potential training or tooling gaps. Time trending can provide additional insights into process changes.
The raw numbers of inconclusive artefacts (N2) can also be useful for trending analysis reflecting a potential need for additional training or process improvements. |
6.3.1.3 Metric: Number of never seen artefacts
| Metric Attribute |
Details |
| Name |
Number of never seen artefacts |
| Description |
This metric tracks the number of artefacts identified by your analysis process that are not found in any known feed. This number can be an indicator of how effective your team is at finding new things, or whether your team is subject to targeted attacks. It is also useful for validating artefact integrity and provenance. |
| Type |
Impact |
| Data Required |
(N1) Number of artefacts not found in any known repository |
| Calculation |
N1 |
| Measure |
Number |
| Notes |
Use of this metric assumes your team is effective at searching known indicators, whether in public or private repository.
The inverse of this metric could be listed as “Hash Verification Success Rate”. Either number will suffice - number not found, or number found. |
6.3.1.4 Time to identify key artefact attributes
| Metric Attribute |
Details |
| Name |
Time to Identify Key artefact Attributes |
| Description |
Measures the time taken to identify critical artefact attributes such as file types or cryptographic hashes. This can indicate efficiency improvements or bottlenecks |
| Type |
Efficiency |
| Data Required |
For each analysis a
(N1) Start time of analysis
(N2) Time at which key attributes are identified and the analysis is complete |
| Calculation |
median({a(N2-N1)} ) |
| Measure |
median |
| Notes |
Your team will benefit from analysing the median trend over a period, e.g., quarterly.
As with all time metrics be careful using this as a performance metric thereby potentially sacrificing quality to reach a target. |
6.3.2 Function: Reverse engineering
Metrics: The following metrics are defined for this function:
- Number of reversed engineered suspicious artefacts
- Number of IOCs identified from reverse engineering
- Time to complete reverse engineering
6.3.2.1 Metric: Number of reversed engineered suspicious artefacts
| Metric Attribute |
Details |
| Name |
Number of reversed engineered suspicious artefacts |
| Description |
Count how many suspicious artefacts were reversed engineered during a time frame, ensuring completeness and throughput of the service in an organisation. |
| Type |
Implementation |
| Data Required |
(N1) Number of reversed engineered suspicious artefacts |
| Calculation |
N1 |
| Measure |
Number |
| Notes |
A platform to track and maintain historical data of reverse engineering processes is required.
This metric can be captured as a raw number over a period or averaged over a period of time and/or other factors. |
6.3.2.2 Metric: Number of IOCs collected during reverse engineering
| Metric Attribute |
Details |
| Name |
Number of IOCs collected during reverse engineering |
| Description |
Count how many IOCs were discovered during reverse engineering during a specific timeframe, including all techniques. (dynamic, static, decompilation, etc.) |
| Type |
Impact |
| Data Required |
(N1) Number of IOCs collected as result of reverse engineering |
| Calculation |
N1 |
| Measure |
Number |
| Notes |
A platform to track and maintain historical data of reverse engineering processes is required.
To effectively track and utilize the Number of IOCs collected during reverse engineering, it is essential to establish a clear and standardized definition of an IOC. This ensures consistency and enhances the reliability of this metric. Examples of IOCs include IP addresses, domains, registry keys, hashes, Mutex names, Process names, Network artefacts, Email address and Malware behaviour patterns.
This metric can be captured as a raw number over a period, or averaged over a period and/or other factors. |
6.3.2.3 Metric: Time to complete reverse engineering analysis
| Metric Attribute |
Details |
| Name |
Time to complete reverse engineering |
| Description |
Measures the time elapsed from the start of the reverse engineering process to its completion, for an individual artefact. |
| Type |
Efficiency |
| Data Required |
(N1) Time at which reverse engineering process started
(N2) Time at which reverse engineering process completed |
| Calculation |
N2 - N1 |
| Measure |
Number |
| Notes |
A platform to track and maintain historical data of reverse engineering processes is required.
Evaluate this metric to generate statistical analyses over time and type, such as median. This metric does not necessarily capture effort required for the reverse engineering process. |
6.3.2.4 Metric: Effort to complete reverse engineering analysis
| Metric Attribute |
Details |
| Name |
Effort to complete reverse engineering analysis |
| Description |
Measures the amount of effort required to reverse engineer an individual artefact. |
| Type |
Implementation |
| Data Required |
(N1) Effort required to reverse engineer an artefact |
| Calculation |
N1 |
| Measure |
Number |
| Notes |
It may be difficult to estimate the effort needed to complete the reverse engineering activities and likewise difficult for the reverse engineering team to keep track of their effort expenditure.
Keep these activities as simple as possible to not add unnecessary overhead. One method to consider is to use a point system that creates a rough estimate of the activities. (Agile story pointing provides a methodology for this. Reference this Asana blog post.) |
6.3.3 Function: Run time or dynamic analysis
The following metrics are defined for this function:
- Number of artefacts analysed during dynamic analysis
- Number of IOCs identified during dynamic analysis
- Number of new IOCs identified during dynamic analysis
- Percentage of artefacts requiring re-analysis
- Incidents where runtime analysis informed containment or mitigation
6.3.3.1 Metric: Number of artefacts analysed during dynamic analysis
| Metric Attribute |
Details |
| Name |
Number of artefacts analysed during dynamic analysis |
| Description |
This metric keeps track of the number of artefacts that are analysed. It can be used in trending to keep track of how the team is operating, as well as in other metrics for successful analysis and new IOCs identified. |
| Type |
Impact |
| Data Required |
(N1) Number of artefacts were analysed during dynamic analysis |
| Calculation |
N1 |
| Measure |
Number |
| Notes |
You will need a proper platform to keep track of the artefacts that are analysed during the dynamic analysis process |
6.3.3.2 Metric: Number of IOCs identified during dynamic analysis
| Metric Attribute |
Details |
| Name |
Number of IOCs identified during dynamic analysis |
| Description |
Tracks the total number of IOCs observed through dynamic analysis, regardless of whether they are new or previously known. This provides a sense of the volume and breadth of indicators generated by this analysis function. |
| Type |
Impact |
| Data Required |
(N1) Number of IOCs identified during dynamic analysis |
| Calculation |
N1 |
| Measure |
Number |
| Notes |
You will need a method for extracting and recording IOCs from dynamic analysis sessions, such as from sandbox reports or network capture logs.
This metric helps show the observable footprint of suspicious artefacts when executed. It may include URLs, IPs, domains, file hashes, mutexes, and more. |
6.3.3.3 Metric: Number of new IOCs identified during dynamic analysis
| Metric Attribute |
Details |
| Name |
Number of new IOCs identified during dynamic analysis |
| Description |
Tracks the number of previously unknown IOCs discovered during dynamic analysis. This helps measure the uniqueness and added value of the analysis to the organisation’s threat intelligence. |
| Type |
Impact |
| Data Required |
(N1) Number of IOCs identified during dynamic analysis that were not already present in internal or shared threat intelligence sources. |
| Calculation |
N1 |
| Measure |
Number |
| Notes |
This metric requires comparison of extracted IOCs against an up-to-date IOC repository to confirm novelty. Matching may need to account for IOC type and normalization (e.g., domain variations).
You will need a proper platform to keep track of the suspicious IOCs that are analysed during the dynamic analysis process |
6.3.3.4 Metric: Percentage of artefacts requiring re-analysis
| Metric Attribute |
Details |
| Name |
Percentage of artefacts requiring re-analysis |
| Description |
Measures the percentage of artefacts that require re-analysis after the initial runtime analysis, indicating the thoroughness of the first analysis or the need for further investigation. |
| Type |
Efficiency |
| Data Required |
(N1) Total number of artefacts analysed
(N2) Number of artefacts that required re-analysis |
| Calculation |
(N2 / (N1) *100 |
| Measure |
Percentage |
| Notes |
Identifying when a re-analysis is necessary; may require thorough record-keeping and review of analysis logs.
A higher percentage of re-analysis may indicate a need for improved initial analysis processes or more effective tools. |
| Metric Attribute |
Details |
| Name |
Incidents where runtime analysis informed containment or mitigation |
| Description |
Tracks how often runtime analysis directly contributes to informing containment or mitigation strategies for incidents. This metric ties the value of dynamic analysis to actual incident response efforts. |
| Type |
Effectiveness |
| Data Required |
(N1) Number of incidents where runtime analysis informed containment or mitigation |
| Calculation |
N1 |
| Measure |
Number |
| Notes |
Requires detailed documentation linking dynamic analysis results to specific incident containment or mitigation actions.
Demonstrates the real-world impact of runtime analysis in reducing threat impact through proactive response strategies. |
6.3.4 Function: Comparative analysis
The following metrics are defined for this function:
- Number of artefacts correlated per threat actor
- Number of IOCs per threat actor
| Metric Attribute |
Details |
| Name |
Number of artefacts correlated per threat actor |
| Description |
How many artefacts were correlated per threat actor. This metric can show how many correlations were done by artefact correlation analysis, more is better. |
| Type |
Efficiency |
| Data Required |
N1 = Number of artefacts |
| Calculation |
N1 |
| Measure |
Number |
| Notes |
You will need a repo of artefacts and tools to compare historically or "retro-hunting" against known and new threat actors. |
| Metric Attribute |
Details |
| Name |
Number of IOCs correlated per threat actor |
| Description |
A count of the IOCs that are associated with a specific threat actor. |
| Type |
Efficiency |
| Data Required |
(N1) Number of IOC per threat actor |
| Calculation |
N1 |
| Measure |
Number |
| Notes |
You will need a repo of artefacts and tooling to compare historically or "retro-hunting" against known and new threat actors. |
6.4 Service: Mitigation and recovery
6.4.1 Function: Response plan establishment
Metrics: The following metrics are defined for this function:
- Incidents meeting successful resolution criteria
- Revenue Loss due to Security Incidents
6.4.1.1 Metric: Incidents meeting successful resolution criteria
| Metric Attribute |
Details |
| Name |
Incidents meeting successful resolution criteria |
| Description |
This metric provides insight into the efficiency and effectiveness of the Incident Response Plan by measuring the total number of incidents that have been successfully resolved within a given period.
It helps organisations evaluate their ability to handle disruptions and restore normal operations, contributing to overall service quality and customer satisfaction.
The criteria for successful resolution should be defined in the response plan. (See notes) |
| Type |
Effectiveness |
| Data Required |
(N1) Number of Incidents Resolved
(N2) Incidents Meeting All Resolution Criteria as defined by response plan |
| Calculation |
(N2) / (N1) * 100 |
| Measure |
Percentage |
| Notes |
Data Accuracy: Ensuring the accuracy of incident data and feedback
Defining Resolution Criteria: Establishing clear and consistent criteria for what constitutes a successfully resolved incident
An incident may be considered successfully resolved when it meets predefined criteria such as issue closure, customer satisfaction, compliance with service level agreements (SLAs), and confirmation from the reporters that the issue is resolved.
Possible Resolution Criteria:
- Closure: The incident is marked as closed in the tracking system.
- Stakeholder Satisfaction: Positive feedback or confirmation from the affected party that the issue has been resolved.
- Compliance with SLAs: The incident resolution meets the time and quality standards defined in service level agreements.
- Verification: Final verification or acceptance by the incident reporter that the issue has been resolved to their satisfaction.
An essential part of an incident response is to clearly define the resolution criteria that are applicable to the organisation. |
6.4.1.2 Metric: Revenue loss due to security incidents
| Metric Attribute |
Details |
| Name |
Revenue loss due to security incidents |
| Description |
Measure the total revenue loss caused by security incidents over a specific period. This metric evaluates the financial and operational impact of security breaches, highlighting how incidents affect business continuity and profitability. The lower the revenue loss, the more effective the incident response and recovery processes. |
| Type |
Impact |
| Data Required |
Downtime measure:
Identify Affected Systems/Services: Determine which systems or services were impacted by the incident.
- 𝑛 = the number of affected systems
Track Duration of Downtime: Measure the time (in hours or minutes) that each affected system or service was unavailable or operating at reduced capacity.
- End Timei = the time the incident was resolved for Systemi
- Start Timei = the time the incident was resolved for Systemi
Quantify Revenue Loss:
- (N1) Revenue per Unit of Time: Calculate your business’s revenue per hour or day, depending on the severity of the incident.
- (N2) Other Costs: Factor in additional financial impacts such as regulatory fines, customer compensation, or potential loss of future business due to reputational damage.
- (N3) Impact Factor: If operations were partially affected (e.g., slower sales, reduced customer engagement), adjust the calculation based on the percentage of impact. For example, if the business operated at 50% capacity, the Impact Factor would be 0.5).
|
| Calculation |
Calculate Total Downtime:
Add up the duration for all affected systems/services to get the total downtime for the incident:
Estimate Lost Revenue:
Multiply the total downtime by the average revenue lost per hour or day:
|
| Measure |
Number |
| Notes |
Note: This metric is significantly complicated to derive as evidenced with the data accuracy barriers listed below. We have included here as a starting point for those organisations interested in calculating financial impact.
Data Accuracy: Ensuring the accuracy of incident data and feedback. It follows some barriers:
- Complex Incident Scope: If multiple systems or services are affected in different ways, accurately measuring total downtime can be difficult. Some systems may experience partial degradation rather than full outages, which complicates the measurement.
- Start and End Time Discrepancies: Determining the precise start and end time of the incident can be difficult, especially if the detection of the issue is delayed or if different systems are affected at different times.
- Variable Revenue Flows: Businesses may experience fluctuating revenue depending on the time of day, season, or other factors. Calculating an average revenue loss may not fully capture the true financial impact, especially during peak periods.
- Data Silos: In large organisations, operational and financial data may be housed in different systems or departments, making it challenging to integrate all necessary data for calculating lost revenue.
- Global Operations: Businesses operating in multiple regions with different time zones and currencies face additional complexities in calculating revenue loss consistently across regions.
Account for Indirect Costs:
- Reputation Damage: Consider long-term financial impacts due to lost customers, diminished trust, or reputational harm that could result in future revenue losses.
- Customer Compensation: Include any direct compensation to customers (e.g., refunds, discounts).
- Operational Costs: Account for the costs of response efforts, such as additional labour, third-party services, or replacement of damaged equipment.
Lost revenue example:
If your business normally generates $10,000 per hour, and a security incident caused a system outage for 3 hours, with a 50% reduction in operational capacity, the revenue loss would be calculated as:
You may want to compare your total revenue loss over a period against an “expected loss” baseline for similar organisations. |
6.4.2 Function: Ad hoc measures and containment
Metrics: The following metric is defined for this function:
6.4.2.1 Metric: Time to contain
| Metric Attribute |
Details |
| Name |
Time to contain |
| Description |
Measures the efficacy of containing a detected threat or security incident |
| Type |
Efficiency |
| Data Required |
(N1) The time at which the event was detected
(N2) The time of the incident was contained |
| Calculation |
N2 - N1 |
| Measure |
Number |
| Notes |
Either a ticketing system adept at accurately recording such data or manual log analysis is necessary to assess the timing of the event occurrence.
Some corner cases are hard to identify when a threat is contained, sometimes multiples containing phases happen inside the same incident.
Refer to Security Incident Timing Metrics on the FIRST Portal
This measurement usually spans minutes, hours, or days, contingent upon the complexity and severity of the incident. Gathering data for this metric involves timestamping the instant when containment measures are successfully implemented and validated.
This timestamp can be extracted from incident tracking systems, security logs, or documented evidence of containment efforts.
It is recommended the logs are aligned with the same time zone. |
6.4.3 Function: System restoration
Metrics: The following metrics are defined for this function:
- Median time of resolution
- Effectiveness of Incident Response in Security Posture Improvement
- Percentage of actionable measures successfully implemented
| Metric Attribute |
Details |
| Name |
Median time of resolution |
| Description |
The metric measures the time between the onset of the incident and the point at which systems and services are restored to full functionality and capacity. |
| Type |
Efficiency |
| Data Required |
For each incident a:
(N1) Incident start time
(N2) Time at which systems and services are restored |
| Calculation |
median({a(N2-N1)}) |
| Measure |
Median |
| Notes |
It may be difficult to know the exact time at which services are restored, and restored to “full” functionality and capacity, but it is an important point to capture. As with other data points that are difficult to determine, use a common-sense approach and keep the determination as simple as possible.
Refer to Security Incident Timing Metrics created by the FIRST Metrics SIG for more information. |
6.4.3.2 Metric: Effectiveness of incident response in security posture improvement
| Metric Attribute |
Details |
| Name |
Effectiveness of incident response in security posture improvement |
| Description |
This metric tracks the number of security incidents that resulted in actionable steps (e.g., corrective, preventive, and improvement actions) aimed at strengthening the organisation's security posture. High effectiveness indicates that more incidents are thoroughly investigated, and action plans are created to prevent future occurrences. |
| Type |
Effectiveness |
| Data Required |
(N1) Incident Count: Total number of incidents over a period
(N2) Actionable Incidents: Incidents that resulted in a formalized action plan (e.g., process change, new controls, system patches). |
| Calculation |
(N2 / N1) * 100 |
| Measure |
Percentage |
| Notes |
How this metric can be Interpreted:
- High (>75%): Indicates proactive security posture, with most incidents leading to action plans.
- Moderate (50%-75%): Incidents often reviewed but may lack consistent follow-up actions.
- Low (<50%): Many incidents are not driving actionable improvements, suggesting potential areas for response process improvement.
Example:
If you had 100 incidents and 80 of them generated action plans:
E = 80 / 100 * 100
E = 80%
An 80% effectiveness rate suggests that the incident response process is well-aligned with security improvement goals. |
6.4.3.3 Metric: Percentage of actionable measures successfully implemented
| Metric Attribute |
Details |
| Name |
Percentage of actionable measures successfully implemented |
| Description |
Recognizing that successful follow-up on recommended security measures and recommendations may be a lengthy process with much work outside the scope of the CSIRT, this metric tracks how well action plans are implemented. |
| Type |
Impact |
| Data Required |
(N1) Number of recommended security measures
(N2) Number of recommended security measures successfully closed |
| Calculation |
N2 / N1 * 100 |
| Measure |
Percentage |
| Notes |
As mentioned in the description, the CSIRT will often not have control over how many measures are successfully implemented. Therefore, the metric should not be used as a performance indicator. Instead, it should be used as an indicator of the broad impact of the security program and partnerships. |
Metrics: The following metrics are defined for this function:
Metrics: The following metric is defined for this Service:
- Effectiveness of incident coordination stakeholder survey
6.5.0.1 Metric: Effectiveness of incident coordination stakeholder survey
| Metric Attribute |
Details |
| Name |
Effectiveness of incident coordination stakeholder survey |
| Description |
This metric aims to quantify timeliness, relevance and clarity of coordination communication and quality of the corresponding incident report for incidents with severity X and above. Please see the notes and detailed metric descriptions for full details. |
| Type |
Effectiveness |
| Data Required |
Ask relevant stakeholders to rate their response from 1 to 5 (5 being best, consider including N/A as an option)
Q1 How would you rate how relevant the information shared was to you? (6.5.3)
Q2 How would you rate the ability of the CSIRT to coordinate and maintain situational awareness during the incident? (6.5.4)
Q3 Was the information regarding current activities delivered in a timely fashion? (6.5.5)
Q4 How would you rate the overall quality of the finished incident report? (6.5.5) |
| Calculation |
You can use the metrics as is, or do an average, or a weighted average if some metrics are more important to you than others. |
| Measure |
n/a |
| Notes |
If your organisation does not have an approved survey platform, then consideration should be made to find one that suits your needs regarding confidentiality and security in general.
This metric covers the functions 6.5.3, 6.5.4, 6.5.5.
You can expand the survey method to other areas of your incident coordination service. |
6.5.1 Function: Communication
Metrics: The following metric is defined for this function:
- Communication channel downtime
6.5.1.1 Metric: Communication channel downtime
| Metric Attribute |
Details |
| Name |
Communication channel downtime |
| Description |
This metric measures the time elapsed since the last received communication. If this duration exceeds expected or normal thresholds, it may indicate a potential issue with your communication channel. Use this metric to help decide when to test whether the channel is still functioning properly. |
| Type |
Effectiveness |
| Data Required |
(N1) Time of last message in communication channel
(N2) Current time |
| Calculation |
N2 - N1 |
| Measure |
Number |
| Notes |
This metric can be repeated for internal and external communication channels if needed. |
6.5.2 Function: Notification distribution
Metrics: The following metrics are defined for this function:
- None; no metrics are defined for this function, but it is important to ensure that all required entries are identified and added to communication channels.
Metrics: The following metrics are defined for this function:
- Relevance of notification to recipients
6.5.3.1 Metric: Relevance of notification to recipients
| Metric Attribute |
Details |
| Name |
Relevance of notification to recipients |
| Description |
This metric aims to measure the relevance of the notification to the recipients by surveying them. |
| Type |
Effectiveness |
| Data Required |
(N1) The answer to survey question #1; a set of numbers between 1 and 5 from surveyed entities |
| Calculation |
N1 |
| Measure |
Number |
| Notes |
This metric is designed to be bundled with other survey results from 6.5a. |
6.5.4 Function: Activities coordination
The following metric is defined for this function:
- Effectiveness of incident coordination and situational awareness development
6.5.4.1 Metric: Effectiveness of incident coordination and situational awareness development
| Metric Attribute |
Details |
| Name |
Effectiveness of incident coordination and situational awareness development |
| Description |
This metric aims to measure the ability of the CSIRT to do incident coordination and create situational awareness, as observed by incident participants. |
| Type |
Effectiveness |
| Data Required |
(N1) The answer to survey question Q2; A number between 1 and 5 from surveyed entities (or N/A) |
| Calculation |
N1 |
| Measure |
Number |
| Notes |
This metric is designed to be bundled with other survey results from 6.5a. |
6.5.5 Function: Reporting
The following metrics are defined for this function:
- Stakeholder satisfaction level for timeliness of information
- Stakeholder satisfaction level for incident report
| Metric Attribute |
Details |
| Name |
Stakeholder satisfaction level for timeliness of information |
| Description |
This metric aims to measure the ability of the CSIRT to provide timely reports on situational awareness regarding progress |
| Type |
Effectiveness |
| Data Required |
(N1) The answer to survey question Q3; A number between 1 and 5 from surveyed entities (or N/A) |
| Calculation |
N1 |
| Measure |
Number |
| Notes |
This metric is designed to be bundled with other survey results from 6.5a. |
6.5.5.2 Metric: Stakeholder satisfaction level for incident report
| Metric Attribute |
Details |
| Name |
Stakeholder satisfaction level for incident report |
| Description |
This metric aims to measure the ability of the CSIRT to create incident reports that are understood by stakeholders |
| Type |
Effectiveness |
| Data Required |
(N1) The answer to survey question Q4; A number between 1 and 5 from surveyed entities (or N/A) |
| Calculation |
N1 |
| Measure |
Number |
| Notes |
This metric is designed to be bundled with other survey results from 6.5a. |
Metrics: The following metrics are defined for this function:
6.6 Service: Crisis management support
Metrics: The following metrics are defined for this function:
- Number of crisis communications distributed to constituents
- Time from crisis onset to first communication to constituents
- Percentage of constituent groups reached during crisis communication
- Percentage of communications acknowledged or acted upon by constituents
6.6.1.1 Metric: Number of crisis communications distributed to constituents
| Metric Attribute |
Details |
| Name |
Number of crisis communications distributed to constituents |
| Description |
Tracks the total number of crisis-related communications sent to constituents during a specific crisis. This provides a quantitative measure of outreach effort and messaging activity. |
| Type |
Implementation |
| Data Required |
(N1) Total number of crisis-related communications sent to constituents |
| Calculation |
N1 |
| Measure |
Number |
| Notes |
Requires clear tagging or classification of messages as “crisis-related” in the communication platform or log.
This metric should be tracked over a period such as days or weeks, as crises can vary greatly in length. If there is a defined target for frequency of crisis communications the metric can be used to indicate level of compliance.
Can be broken down further by communication type (email, SMS, portal update) or by constituent group |
6.6.1.2 Metric: Time from crisis onset to first communication to constituents
| Metric Attribute |
Details |
| Name |
Time from crisis onset to first communication to constituents |
| Description |
Measures the responsiveness of the CSIRT communication process during a crisis by tracking how quickly the first message is sent following formal recognition of the crisis. |
| Type |
Efficiency |
| Data Required |
(N1) Timestamp of crisis onset
(N2) Timestamp of first communication to any constituent |
| Calculation |
N2 - N1 |
| Measure |
Number |
| Notes |
Depends on clear documentation of crisis declaration time and communication logs.
Particularly valuable for assessing preparedness and the agility of internal processes. |
6.6.1.3 Metric: Percentage of constituent groups reached during crisis communication
| Metric Attribute |
Details |
| Name |
Percentage of constituent groups reached during crisis communication |
| Description |
Assesses the breadth of communication coverage during a crisis by calculating the percentage of defined constituent groups that received at least one message. |
| Type |
Effectiveness |
| Data Required |
(N1) Number of constituent groups that received at least one crisis communication
(N2) Total number of defined constituent groups |
| Calculation |
(N1 / N2) × 100 |
| Measure |
Ratio |
| Notes |
Requires a well-maintained list of constituent groups and accurate delivery tracking per group.
Can be further analysed by priority level or geography |
6.6.1.4 Metric: Percentage of communications acknowledged or acted upon by constituents
| Metric Attribute |
Details |
| Name |
Percentage of communications acknowledged or acted upon by constituents |
| Description |
Measures the proportion of crisis messages that received a meaningful acknowledgment or prompted a recorded action by the recipient, helping gauge message effectiveness and trust. |
| Type |
Impact |
| Data Required |
(N1) Number of crisis communications acknowledged or acted upon by constituents
(N2) Total number of crisis communications distributed |
| Calculation |
(N1 / N2) × 100 |
| Measure |
Percentage |
| Notes |
Requires response tracking, either via read receipts, follow-up action logs, or ticket responses.
Can be a proxy indicator for both trust in the CSIRT and the relevance/clarity of the message. |
Metrics: The following metrics are defined for this function:
- Time to deliver initial status report after crisis declaration
- Percentage of status reports delivered on time
6.6.2.1 Metric: Time to deliver initial status report after crisis declaration
| Metric Attribute |
Details |
| Name |
Time to deliver initial status report after crisis declaration |
| Description |
Measures the responsiveness of the CSIRT in providing its first situational update after a crisis has been formally declared. |
| Type |
Efficiency |
| Data Required |
(N1) Time of crisis declaration
(N2) Time of first status report delivery |
| Calculation |
(N2) - (N1) |
| Measure |
Number |
| Notes |
Depends on accurate timestamping of both the crisis declaration and report delivery.
Can be benchmarked against policy-defined expectations for initial reporting. Statistical analysis can be performed across a set of times, such as mean or median. |
6.6.2.2 Metric: Percentage of status reports delivered on time
| Metric Attribute |
Details |
| Name |
Percentage of status reports delivered on time |
| Description |
Evaluates how consistently the CSIRT meets pre-established deadlines for delivering crisis-related status reports. |
| Type |
Effectiveness |
| Data Required |
(N1) Number of status reports delivered on time
(N2) Total number of status reports expected during the crisis |
| Calculation |
(N1) / (N2) * 100 |
| Measure |
Percentage |
| Notes |
Requires a pre-defined reporting schedule and consistent tracking of both expectations and actual delivery times.
May be influenced by both internal delays and external coordination issues |
6.6.3 Function: Strategic decisions communication
The following metric is defined for this function:
- Time from operational impact to external notification
6.6.3.1 Metric: Time from operational impact to external notification
| Metric Attribute |
Details |
| Name |
Time from operational impact to external notification |
| Description |
Measures the elapsed time between the time at which normal CSIRT operations are negatively impacted and when that information is communicated externally. |
| Type |
Efficiency |
| Data Required |
(N1) Time at which operational decision was made
(N2) Time of corresponding external notification |
| Calculation |
Mean(N2 − N1) |
| Measure |
Mean |
| Notes |
Capturing decision timestamps accurately may be difficult during fast-moving crises.
Useful for evaluating the responsiveness of CSIRT communications. |
7 Service Area: Vulnerability Management
7.0.0 Vulnerability Management - Service Area Metrics
Each functional area within the six services has associated metrics. In addition, here are four program-wide metrics for the Vulnerability Management service area, designed to provide insight into the overall performance, risk posture, and operational maturity of the vulnerability management service area. Each metric cuts across multiple services and functions in Section 7 and is presented in the standard metrics format.
The following program metrics are included in this Service Area:
- Total number of vulnerabilities handled per reporting period
- Percentage of vulnerabilities with defined remediation or mitigation
- Mean time from vulnerability intake to remediation
- Distribution of vulnerabilities by severity and asset class
7.0.0.1 Metric: Total number of vulnerabilities handled per reporting period
| Metric Attribute |
Details |
| Name |
Total number of vulnerabilities handled per reporting period |
| Description |
Measures the volume of vulnerabilities processed by the organisation across all intake, analysis, coordination, and response activities. |
| Type |
Implementation |
| Data Required |
(N1) Count of all unique vulnerabilities recorded and processed |
| Calculation |
N1 |
| Measure |
Number |
| Notes |
Requires centralized vulnerability tracking. May need deduplication of records from different services.
Serves as a high-level indicator of workload or threat landscape exposure. |
| Metric Attribute |
Details |
| Name |
Percentage of vulnerabilities with defined remediation or mitigation |
| Description |
Indicates how many of the vulnerabilities processed resulted in an actionable plan to remediate or mitigate. |
| Type |
Effectiveness |
| Data Required |
(N1) Number of vulnerabilities handled
(N2) Number of vulnerabilities for which remediation or mitigation was defined |
| Calculation |
(N2 / N1) × 100 |
| Measure |
Percentage |
| Notes |
May require validation across multiple teams (e.g., analysis, coordination, IT).
Highlights maturity in turning discovery into action. |
| Metric Attribute |
Details |
| Name |
Mean time from vulnerability intake to remediation |
| Description |
Captures end-to-end efficiency from receiving a report to executing a solution. |
| Type |
Efficiency |
| Data Required |
(N1) Time of vulnerability intake (report receipt or discovery)
(N2) Time of remediation (patch or mitigation applied) |
| Calculation |
N2 − N1 (averaged across all vulnerabilities) |
| Measure |
Mean |
| Notes |
Requires time correlation across functions and possibly across teams.
Useful in identifying where delays occur across the full lifecycle. |
7.0.0.4 Metric: Distribution of vulnerabilities by severity and asset class
| Metric Attribute |
Details |
| Name |
Distribution of vulnerabilities by severity and asset class |
| Description |
Categorizes vulnerabilities to assess risk concentration and trends. |
| Type |
Impact |
| Data Required |
Severity level (e.g., CVSS or High/Medium/Low, etc.)
Asset class (e.g., data center, endpoint, IoT) |
| Calculation |
No calculation. Show trending counts or aggregate statistics across severities and classes. |
| Measure |
Number |
| Notes |
Requires accurate classification and asset inventory mapping.
Can inform targeted investments or patch prioritization policies. |
7.1 Service: Vulnerability discovery / research
7.1.1 Function: Incident response vulnerability discovery
Metrics: The following metrics are defined for this function:
- Number of vulnerabilities identified during incident handling
- Time from incident detection to vulnerability identification
7.1.1.1 Metric: Number of vulnerabilities identified during incident handling
| Metric Attribute |
Details |
| Name |
Number of vulnerabilities identified during incident handling |
| Description |
Tracks the total number of vulnerabilities discovered through investigation of security incidents. Includes both known and previously unknown (zero-day) vulnerabilities. |
| Type |
Implementation |
| Data Required |
(N1) Number of vulnerabilities identified as part of incident handling |
| Calculation |
N1 |
| Measure |
Number |
| Notes |
Requires integration between incident handling records and vulnerability tracking systems; consistent documentation practices are essential.
Useful for understanding how much vulnerability discovery occurs organically through reactive investigation. |
7.1.1.2 Metric: Time from incident detection to vulnerability identification
| Metric Attribute |
Details |
| Name |
Time from incident detection to vulnerability identification |
| Description |
Measures the elapsed time between the detection of an incident and the identification of an exploited vulnerability. |
| Type |
Efficiency |
| Data Required |
(N1) Timestamp of incident detection
(N2) Timestamp when the vulnerability was identified |
| Calculation |
N2 - N1 |
| Measure |
Number |
| Notes |
Requires precise and consistent timestamping of both detection and analysis milestones.
Indicates how quickly the CSIRT can recognize the root cause of an incident at the vulnerability level. |
7.1.2 Function: Public source vulnerability discovery
Metrics: The following metrics are defined for this function:
- Number of vulnerabilities identified from public or third-party sources
- Time from public disclosure to identification by CSIRT
7.1.2.1 Metric: Number of vulnerabilities identified from public or third-party sources
| Metric Attribute |
Details |
| Name |
Number of vulnerabilities identified from public or third-party sources |
| Description |
Tracks the total number of new vulnerabilities discovered by CSIRT staff through public sources or restricted third-party services. |
| Type |
Implementation |
| Data Required |
(N1) Number of vulnerabilities identified from public or third-party sources |
| Calculation |
N1 |
| Measure |
Number |
| Notes |
Requires systematic tracking of source-monitoring activities; some findings may be duplicated across sources or already known.
Can be broken down by source type (e.g., mailing list, vendor site, paid service) and specific source for trend analysis. |
7.1.2.2 Metric: Time from public disclosure to identification by CSIRT
| Metric Attribute |
Details |
| Name |
Time from public disclosure to identification by CSIRT |
| Description |
Measures the delay between the public or third-party disclosure of a vulnerability and the point at which CSIRT staff formally identify or log it. |
| Type |
Impact |
| Data Required |
(N1) Timestamp of public or third-party disclosure
(N2) Timestamp of CSIRT identification |
| Calculation |
N2 - N1 |
| Measure |
Number |
| Notes |
May require integration with source monitoring tools or manual tracking; disclosure time may be unclear or approximate.
Shorter times indicate more responsive monitoring and better situational awareness. |
7.1.3 Function: Vulnerability research
Metrics: The following metric is defined for this function:
- Number of new vulnerabilities identified by CSIRT
7.1.3.1 Metric: Number of new vulnerabilities identified by CSIRT
| Metric Attribute |
Details |
| Name |
Number of new vulnerabilities identified by CSIRT |
| Description |
This metric is a count of how many new vulnerabilities were discovered by the CSIRT per period (year/month). It tracks the number of new vulnerabilities discovered by the CSIRT through deliberate research activities, such as fuzz testing or reverse engineering. |
| Type |
Implementation |
| Data Required |
(N1) Number of new vulnerabilities discovered by the CSIRT |
| Calculation |
N1 |
| Measure |
Number |
| Notes |
Requires consistent internal documentation and confirmation that the vulnerability is indeed new (not already catalogued by others).
Can be further categorized by discovery methods (e.g., fuzzing, reverse engineering, static analysis) for internal reporting. |
7.2 Service: Vulnerability report intake
7.2.1 Function: Vulnerability report receipt
Metrics: The following metrics are defined for this function:
- Number of vulnerability reports received from external sources
- Time to acknowledge vulnerability report
- Vulnerability reporting channel up time
7.2.1.1 Metric: Number of vulnerability reports received from external sources
| Metric Attribute |
Details |
| Name |
Number of vulnerability reports received from external sources |
| Description |
Tracks the total number of vulnerability reports received from constituents or third parties during a defined period. |
| Type |
Implementation |
| Data Required |
(N1) Number of vulnerability reports received through official channels |
| Calculation |
N1 |
| Measure |
Number |
| Notes |
Requires consistent tagging or classification of reports as "vulnerability reports" and central logging of all intake channels.
Can be broken down by source type (e.g., constituent, researcher, PSIRT) or intake method (email, portal). |
7.2.1.2 Metric: Vulnerability reporting channel up time
| Metric Attribute |
Details |
| Name |
Vulnerability reporting channel up time |
| Description |
Measures the percentage of time that the CSIRT's advertised vulnerability reporting channels (e.g., email, web form, portal) are available and functioning. |
| Type |
Implementation |
| Data Required |
(N1) Total operational time of reporting channels
(N2) Total time in the monitoring period |
| Calculation |
N1 / N2 * 100 |
| Measure |
Number |
| Notes |
Requires automated monitoring tools or manual tracking of uptime across intake mechanisms.
Downtime may result in lost or delayed reports; this is critical for maintaining trust and accessibility. |
7.2.1.3 Metric: Time to acknowledge vulnerability report
| Metric Attribute |
Details |
| Name |
Time to acknowledge vulnerability report |
| Description |
This metric measures the amount of time it takes your team to acknowledge receipt of the vulnerability report. |
| Type |
Efficiency |
| Data Required |
(N1) Time at which the vulnerability report was received
(N2) Time at which the vulnerability report was acknowledged |
| Calculation |
N2 - N1 |
| Measure |
Number |
| Notes |
Requires clear logging of both report receipt time and acknowledgment time.
Helps evaluate professionalism and responsiveness in early-stage communication with reporters. As with other "time to" metrics, this can be analysed statistically, e.g., median time to acknowledge. |
7.2.2 Function: Vulnerability report triage and processing
Metrics: The following metrics are defined for this function:
- Percentage of vulnerability reports triaged within defined time frame
- Percentage of vulnerability reports forwarded for handling
7.2.2.1 Metric: Percentage of vulnerability reports triaged within defined time frame
| Metric Attribute |
Details |
| Name |
Percentage of vulnerability reports triaged within defined time frame |
| Description |
Measures how many received reports were reviewed, categorized, and acted upon (e.g., forwarded or dismissed) within a policy-defined period (e.g., 3 business days). |
| Type |
Efficiency |
| Data Required |
(N1) Number of reports triaged within defined time frame
(N2) Total number of reports received |
| Calculation |
(N1 / N2) × 100 |
| Measure |
Percentage |
| Notes |
Requires accurate tracking of intake, triage timestamps, and clear definition of what constitutes triage completion.
Reflects responsiveness and operational discipline in early vulnerability handling. |
7.2.2.2 Metric: Percentage of vulnerability reports forwarded for handling
| Metric Attribute |
Details |
| Name |
Percentage of vulnerability reports forwarded for handling |
| Description |
Measures the proportion of received reports that were formally routed for follow-up (e.g., passed to a Vulnerability Analysis service or external party) after triage. |
| Type |
Implementation |
| Data Required |
(N1) Number of reports forwarded after triage
(N2) Total number of triaged reports |
| Calculation |
(N1 / N2) × 100 |
| Measure |
Percentage |
| Notes |
Requires clear recordkeeping and defined criteria for routing decisions.
Indicates how often reports are considered actionable enough for further attention, either internally or externally. |
7.3 Service: Vulnerability analysis
7.3.1 Function: Vulnerability triage (validation and categorization)
Metrics: The following metrics are defined for this function:
- Percentage of vulnerabilities categorized and prioritized within defined timeframe
- Distribution of vulnerabilities by category
7.3.1.1 Metric: Vulnerabilities categorized and prioritized within defined timeframe
| Metric Attribute |
Details |
| Name |
Vulnerabilities categorized and prioritized within defined time frame |
| Description |
Measures how many confirmed vulnerabilities were categorized and prioritized within a predefined time window (e.g., 3 business days) following assignment to the analysis team. |
| Type |
Efficiency |
| Data Required |
(N1) Number of vulnerabilities categorized and prioritized within timeframe
(N2) Total number of confirmed vulnerabilities received for triage |
| Calculation |
(N1 / N2) * 100 |
| Measure |
Percentage |
| Notes |
Requires clear tracking of handoff and triage completion timestamps; categories and prioritization levels must be formally recorded.
Reflects timeliness in preparing vulnerabilities for further analysis or coordination. |
7.3.1.2 Metric: Distribution of vulnerabilities by category
| Metric Attribute |
Details |
| Name |
Distribution of vulnerabilities by category |
| Description |
Tracks the proportion of vulnerabilities assigned to each predefined category during triage, helping to identify trends in vulnerability types over time. |
| Type |
Impact |
| Data Required |
(N1) Number of vulnerabilities per category (e.g., N1a = injection, N1b = misconfiguration, etc.)
(N2) Total number of vulnerabilities categorized |
| Calculation |
for each category x:
(N1x / N2) × 100 |
| Measure |
Percentage |
| Notes |
Requires a standardized and enforced categorization scheme; may be hard to compare across analysts or time periods without normalization.
Useful for trend analysis, capacity planning, and directing training or tooling improvements. |
7.3.2 Function: Vulnerability root cause analysis
Metrics: The following metric is defined for this function:
- Percentage of vulnerabilities with documented root cause and exploitation conditions
7.3.2.1 Metric: Percentage of vulnerabilities with documented root cause and exploitation conditions
| Metric Attribute |
Details |
| Name |
Percentage of vulnerabilities with documented root cause and exploitation conditions |
| Description |
Measures how many vulnerabilities have a completed analysis that includes both the underlying root cause (e.g., design or implementation flaw) and the conditions under which the vulnerability could be exploited. |
| Type |
Implementation |
| Data Required |
(N1) Number of vulnerabilities with documented root cause and exploitation conditions
(N2) Total number of vulnerabilities accepted for analysis |
| Calculation |
(N1 / N2) * 100 |
| Measure |
Percentage |
| Notes |
Requires clear documentation standards; some analyses may remain incomplete due to limited access to source code, limited context, or dependency on third-party vendors.
This metric reflects completion of a full root cause analysis as defined by the function outcome. In cases where only the root cause or exploitation conditions are identified, but not both, the vulnerability is not counted in (N1). Partial findings may still be valuable and can be tracked separately through internal flags or workflow statuses. |
Metrics: The following metric is defined for this function:
- Percentage of analysed vulnerabilities with documented remediation or mitigation plan
| Metric Attribute |
Details |
| Name |
Percentage of analysed vulnerabilities with documented remediation or mitigation plan |
| Description |
Measures how many vulnerabilities, once analysed, resulted in a documented remediation (e.g., patch, code change) or mitigation (e.g., workaround, configuration guidance) plan. |
| Type |
Implementation |
| Data Required |
(N1) Number of vulnerabilities with documented remediation or mitigation plans
(N2) Total number of vulnerabilities analysed |
| Calculation |
(N1 / N2) * 100 |
| Measure |
Percentage |
| Notes |
CSIRTs may rely on vendors or third parties for fixes, which can delay or limit visibility; mitigation strategies may be incomplete or unofficial.
This metric reflects whether an actionable plan was established, regardless of who develops or applies it. Vulnerabilities documented as accepted risks (with justification) may be excluded from (N1) or tracked separately depending on organisational policy. |
7.4 Service: Vulnerability coordination
7.4.1 Function: Vulnerability notification/reporting
Metrics: The following metrics are defined for this function:
- Percentage of vulnerabilities for which notification was sent to appropriate parties
- Vulnerability - time to notify
7.4.1.1 Metric: Vulnerabilities for which notification was sent to appropriate parties
| Metric Attribute |
Details |
| Name |
Vulnerabilities for which notification was sent to appropriate parties |
| Description |
Measures how many confirmed vulnerabilities were reported to at least one relevant CVD participant (e.g., vendor, PSIRT, coordinator) as part of the disclosure and coordination process. |
| Type |
Implementation |
| Data Required |
(N1) Number of vulnerabilities for which notification was sent to a relevant CVD participant
(N2) Total number of confirmed vulnerabilities requiring notification |
| Calculation |
(N1 / N2) * 100 |
| Measure |
Percentage |
| Notes |
Requires clear documentation of notification attempts and recipient relevance; some parties may be hard to identify or reach.
"Appropriate parties" should be defined in your coordination policy or process. This metric reflects completeness of outreach, not the quality of response. |
7.4.1.2 Metric: Vulnerability - time to notify
| Metric Attribute |
Details |
| Name |
Vulnerability - time to notify |
| Description |
Captures the raw time interval between the confirmation of a vulnerability and the moment external parties are notified. This provides a baseline for statistical analysis and operational review. |
| Type |
Efficiency |
| Data Required |
(N1) Time of vulnerability confirmation
(N2) Time of vulnerability notification |
| Calculation |
N2 - N1 |
| Measure |
Number |
| Notes |
Requires accurate and auditable logging of confirmation and notification events.
Use statistical analysis tools (e.g., median, percentiles) separately to identify trends, outliers, or policy deviations. |
7.4.2 Function: Vulnerability stakeholder coordination
Metrics: The following metrics are defined for this function:
- None; No metrics are defined for this function. While the function is essential to coordinated vulnerability disclosure it is not independently measurable due to its reliance on external stakeholder actions and informal communication dynamics.
7.5 Service: Vulnerability disclosure
7.5.1 Function: Vulnerability disclosure policy and infrastructure maintenance
Metrics: The following metrics are defined for this function:
None; No metrics are defined for this function. It establishes foundational policy and infrastructure but does not yield directly measurable outcomes appropriate for routine performance metrics. If measuring if policy updates or stakeholder transparency become part of an audit or maturity initiative, consider adding metrics such as percentage of constituents with access to policy or number/frequency of updates to policy.
7.5.2 Function: Vulnerability announcement/communication/dissemination
Metrics: The following metric is defined for this function:
- Time to disseminate vulnerability information
| Metric Attribute |
Details |
| Name |
Time to disseminate vulnerability information |
| Description |
Measures the elapsed time between receipt of a vulnerability report and dissemination of constituent- or public-facing vulnerability information. Indicates how quickly the CSIRT can deliver actionable insights. |
| Type |
Efficiency |
| Data Required |
(N1) Time of vulnerability report receipt
(N2) Time of vulnerability information dissemination |
| Calculation |
N2 - N1 |
| Measure |
Number |
| Notes |
Timing may be affected by dependency on vendor coordination, internal review cycles, or communication policy constraints.
Use of the median is preferred to mitigate the effect of outliers. Be clear on what constitutes "dissemination" (e.g., advisory publication, direct communication, etc.). |
7.5.3 Function: Post-vulnerability disclosure feedback
Metrics: The following metrics are defined for this function:
- Percentage of post-disclosure inquiries responded to within defined time frame
- Number of follow-up incidents or implementation issues reported by constituents
7.5.3.1 Metric: Percentage of post-disclosure inquiries responded to within defined time frame
| Metric Attribute |
Details |
| Name |
Percentage of post-disclosure inquiries responded to within defined time frame |
| Description |
Tracks the percentage of constituent or stakeholder inquiries received after a vulnerability disclosure that are responded to within a pre-established timeframe. This reflects the responsiveness and readiness of the CSIRT to support constituents. |
| Type |
Effectiveness |
| Data Required |
(N1) Total number of post-disclosure inquiries received
(N2) Number of inquiries responded to within the defined time frame |
| Calculation |
(N2 / N1) * 100 |
| Measure |
Percentage |
| Notes |
May require integration between feedback channels and case management systems to track timing accurately.
The defined time frame should be consistent with expectations (e.g., 48 or 72 hours).
Median response time may also be tracked for internal review. |
7.5.3.2 Metric: Number of follow-up incidents or implementation issues reported by constituents
| Metric Attribute |
Details |
| Name |
Number of follow-up incidents or implementation issues reported by constituents |
| Description |
Measures how many constituents report either new incidents or implementation challenges related to the disclosed vulnerability. This provides insight into disclosure clarity and the downstream impact of vulnerability communication. |
| Type |
Impact |
| Data Required |
(N1) Number of follow-up incident reports or implementation challenges referencing a disclosed vulnerability |
| Calculation |
N1 |
| Measure |
Number |
| Notes |
Requires tagging or associating post-disclosure reports with specific disclosures.
May inform future improvements in communication format, mitigation guidance, or constituent outreach. |
7.6 Service: Vulnerability response
7.6.1 Function: Vulnerability detection / scanning
Metrics: The following metrics are defined for this function:
- Vulnerability scanning coverage
- Number of penetration tests conducted
- Mean time from vulnerability disclosure to first scan
7.6.1.1 Metric: Vulnerability scanning coverage
| Metric Attribute |
Details |
| Name |
Vulnerability scanning coverage |
| Description |
Measures the percentage of in-scope assets that are covered by vulnerability scanning activities. |
| Type |
Effectiveness |
| Data Required |
(N1) Number of in-scope assets
(N2) Number of in-scope assets scanned for vulnerabilities |
| Calculation |
(N2 / N1) * 100 |
| Measure |
Percentage |
| Notes |
Requires complete and accurate asset inventory, and integration with scanning tools.
Helps assess the breadth of detection efforts. Partial scans or intermittent asset availability can impact this metric.
Depending on the types of vulnerability scans defined by your organisation and the criticality of your scanned assets, you will want to break down your numbers by these variables. |
7.6.1.2 Metric: Number of penetration tests conducted
| Metric Attribute |
Details |
| Name |
Number of penetration tests conducted |
| Description |
Tracks the number of formal penetration tests performed within a given period. |
| Type |
Implementation |
| Data Required |
(N1) Count of completed penetration tests |
| Calculation |
N1 |
| Measure |
Number |
| Notes |
Requires a consistent definition of what constitutes a penetration test and centralized tracking.
Useful for tracking program maturity and compliance with policies or regulations that require periodic testing. |
7.6.1.3 Metric: Mean time from vulnerability disclosure to first scan
| Metric Attribute |
Details |
| Name |
Mean time from vulnerability disclosure to first scan |
| Description |
Measures the responsiveness of the organisation in initiating detection efforts following a known vulnerability announcement. |
| Type |
Efficiency |
| Data Required |
(N1) Time of public disclosure of the vulnerability
(N2) Time of first scan or assessment for that vulnerability |
| Calculation |
N2 −–N1
Take the mean across relevant time spans |
| Measure |
Mean |
| Notes |
Requires timestamped records of both vulnerability disclosure events and scan activities. Coordination may be required.
Helps assess how quickly detection processes are triggered after new threats emerge. Outlier events may warrant additional review. |
Metrics: The following metrics are defined for this function:
- Mean time to remediate detected vulnerabilities
- Percentage of high-severity vulnerabilities remediated within defined time frame
| Metric Attribute |
Details |
| Name |
Mean time to remediate detected vulnerabilities |
| Description |
Measures the average elapsed time between the detection of a vulnerability and its remediation, reflecting how quickly known risks are addressed. |
| Type |
Efficiency |
| Data Required |
(N1) Time of vulnerability detection
(N2) Time of vulnerability remediation |
| Calculation |
N2 −–N1
(averaged across all relevant vulnerabilities and time spans) |
| Measure |
Mean |
| Notes |
Requires integration of vulnerability detection and patch management records with accurate timestamps.
Can help identify bottlenecks in the remediation pipeline. Outliers may require deeper investigation or policy exception tracking. |
| Metric Attribute |
Details |
| Name |
Percentage of high-severity vulnerabilities remediated within defined time frame |
| Description |
Assesses the organisation's ability to meet remediation targets for vulnerabilities with high severity or risk ratings. |
| Type |
Effectiveness |
| Data Required |
(N1) Number of high-severity vulnerabilities detected
(N2) Number of high-severity vulnerabilities remediated within defined timeframe |
| Calculation |
(N2 / N1) * 100 |
| Measure |
Percentage |
| Notes |
Requires consistent severity classification (e.g., CVSS) and policy-driven remediation timeframes.
A key compliance and risk metric often aligned with internal SLAs or regulatory requirements. |
8 Service Area: Situational Awareness
8.1 Service: Data acquisition
8.1.1 Function: Policy aggregation, distillation, and guidance
Metrics: The following metrics are defined for this function:
- Coverage of policies in situational awareness reporting
- Time to update policy context
- Policy-derived context accuracy
8.1.1.1 Metric: Coverage of policies in situational awareness reporting
| Metric Attribute |
Details |
| Name |
Coverage of policies in situational awareness reporting |
| Description |
The purpose of this metric is to measure how much policies are translated into actionable metrics. Measures the percentage of relevant organisational policies successfully aggregated and incorporated into the situational awareness baseline. The situational awareness baseline in this context is the metrics used for reporting. |
| Type |
Effectiveness |
| Data Required |
(N1) Total number of policies
(N2) Number of policies identified in situational awareness reporting |
| Calculation |
(N2 / N1) × 100 |
| Measure |
Percentage |
| Difficulty / Barriers |
Requires up-to-date policy inventories and knowledge of applicable domains. |
| Notes |
Helps assess how well the CSIRT has captured the full policy context required to define acceptable norms and vice versa how actionable the policy landscape of the organisation is.
A variation of this metric could be implementing metrics for the proportion of analysed events that are created based on deviations from defined policy. |
8.1.1.2 Metric: Time to update policy context
| Metric Attribute |
Details |
| Name |
Time to update policy context |
| Description |
Measures how quickly new or revised policies are reflected in situational awareness reporting. |
| Type |
Efficiency |
| Data Required |
(N1) Date policy is approved or revised
(N2) Date policy context is updated in situational awareness system |
| Calculation |
N2 − N1 |
| Measure |
Mean |
| Notes |
This metric may depend on notification workflows between compliance and CSIRT teams.
Indicates responsiveness of policy integration processes. |
8.1.2 Function: Asset mapping to functions, roles, actions, and key risks
Metrics: The following metrics are defined for this function:
- Asset inventory completeness
- Accuracy of role-to-asset mappings
8.1.2.1 Metric: Asset inventory completeness
| Metric Attribute |
Details |
| Name |
Asset inventory completeness |
| Description |
This metric reflects the environment in which the CSIRT operates rather than CSIRT performance.
It is relevant for the CSIRT to understand if it is operating in a managed or unmanaged environment by comparing documentation with the environment observed in the data collected or produced by asset discovery.
Having access to quality data in a managed environment will make the rest of the services provided in the CSIRT more effective and efficient. |
| Type |
Effectiveness |
| Data Required |
(N1) Number of assets listed in inventory
(N2) Total number of assets identified in network discovery |
| Calculation |
(N1 / N2) × 100 |
| Measure |
Percentage |
| Notes |
As noted above this is a difficult metric to gather and maintain but measurable knowledge of your asset inventory is a must. Focus on critical environments; subset your metrics by criticality, place in network (DC, desktop, etc.). Alignment to role is covered in the next metric.
This requires continuous synchronization between inventory and network scanning systems and can be a difficult metric to gather. It may be best to start small with attention to critical environments. |
8.1.2.2 Metric: Accuracy of role-to-asset mappings
| Metric Attribute |
Details |
| Name |
Accuracy of role-to-asset mappings |
| Description |
Measures the percentage of verified correct associations between roles, functions, and assets. |
| Data Required |
(N1) Total mappings sampled or tested
(N2) Number of correctly validated mappings |
| Calculation |
(N2 / N1) × 100 |
| Measure |
Percentage |
| Notes |
Errors in asset inventory can lead to incorrect assumptions about responsibility or risk. Depending on your data sources measuring accuracy might have difficulties. |
8.1.3 Function: Collection
Metrics: The following metrics are defined for this function:
- Data collection against collection objectives
8.1.3.1 Metric: Data collection against collection objectives
| Metric Attribute |
Details |
| Name |
Data collection against collection objectives |
| Description |
This metric measures data collection capability against defined collection objectives. |
| Type |
Implementation |
| Data Required |
(N1) Number of specified data collection objectives fulfilled
(N2) Total number of specified data collection objectives |
| Calculation |
(N1 / N2) × 100 |
| Measure |
Percentage |
| Notes |
You need to define your objectives before you can measure them.
Considerations that can help you build collection objectives:
|
- Geographical footprint (local NatCERTs and sharing communities)
- Verticals/sectors (Different flavours of CNI and sectors have different sharing communities and opportunities like sector CERTs)
- Vendors and partners (vendor specific collection both vulns and breaches)
- Other? |
8.1.4 Function: Data processing and preparation
Metrics: The following metrics are defined for this function:
- Availability of internal asset context in alerts
- External information enrichment
8.1.4.1 Metric: Availability of internal asset context in alerts
| Metric Attribute |
Details |
| Name |
Availability of internal asset context in alerts |
| Description |
Having contextual information for alerts is important for the analysts to do a good job understanding the alert, urgency and overall handling of the alert. |
| Type |
Implementation |
| Data Required |
Alerts handled by your analysts and their metadata defined as required for enrichment (name of the asset owner, their role, their permissions on other assets, their physical working location over time, and more)
(N1) Number of alerts with enrichment requirements fulfilled
(N2) Total number of alerts |
| Calculation |
(N1 / N2) × 100 |
| Measure |
Percentage |
| Notes |
Variation opportunity: Internal asset context is useful for several processes in a CSIRT, such as vulnerability handling processes. Consider what or which variations might make sense in your operational environment.
This metric will not immediately tell you if the missing data is caused by enrichment mechanisms in the CSIRT is failing, or if the data is missing in the asset inventory or data source. |
| Metric Attribute |
Details |
| Name |
External information enrichment |
| Description |
To support the outcome of having data collected be the CSIRT available across its services, we can define what externally collected data is in scope for enrichment and measure its implementation. |
| Type |
Implementation |
| Data Required |
(N1) Defined data points relevant for enrichment
(N2) Data points defined as relevant for enrichment implemented in relevant processes |
| Calculation |
(N2 / N1) * 100 |
| Measure |
Percentage |
| Notes |
Examples of externally collected data could be relations to active campaigns or threat actors, Known Exploited Vulnerabilities, EPSS, etc. |
8.2 Service: Analysis and synthesis
8.2.0 Analysis and synthesis: Service metrics
Each function within this service has associated metrics. In addition, two service level metrics for the Analysis and synthesis service are included.
The following metrics are included in this Service Area
- Analysis outputs supporting decision-making
- Time to produce analysis outputs
8.2.0.1 Metric: Analysis outputs supporting decision-making
| Metric Attribute |
Details |
| Name |
Analysis outputs supporting decision-making |
| Description |
This metric measures the proportion of analysis outputs that are used to support operational or strategic decision-making. This helps assess whether analysis activities are producing actionable insights. |
| Type |
Effectiveness |
| Impact |
High |
| Data Required |
(N1) Number of analysis outputs produced
(N2) Number of analysis outputs used to support decisions |
| Calculation |
N2 / N1 * 100 |
| Measure |
Percentage |
| Notes |
Decision-making may include incident response actions, risk management decisions, operational changes, or communications to constituents. Organizations should define what constitutes “used to support decisions” based on their operational context. |
8.2.0.2 Metric: Time to produce analysis outputs
| Metric Attribute |
Details |
| Name |
Time to produce analysis outputs |
| Description |
This metric measures the time required to produce analysis outputs after relevant data is available. Timely analysis is critical to maintaining an accurate and actionable situational picture. |
| Type |
Efficiency |
| Data Required |
(N1) Time at which sufficient data is available for analysis
(N2) Time at which analysis output is produced |
| Calculation |
N2 - N1 |
| Measure |
Number |
| Notes |
This metric is most useful when analysed using statistical methods such as median. Analysis may be segmented by analysis type or priority. |
8.2.1 Function: Projection and inference
Metrics: The following metrics are defined for this function:
- Time between situational picture updates
- Accuracy of projections and inferences
- Time to produce projections and inferences
8.2.1.1 Metric: Time between situational picture updates
| Metric Attribute |
Details |
| Name |
Time between situational picture updates |
| Description |
This metric measures the time between situational picture updates |
| Type |
Efficiency |
| Data Required |
(N1) Time of last situational picture update
(N2) Time of previous situational picture update |
| Calculation |
N1 - N2 |
| Measure |
Number |
| Notes |
Consider converting N1-N2 to your preferred period (i.e. months) when presenting or interpreting your metric. |
8.2.1.2 Metric: Accuracy of projections and inferences
| Metric Attribute |
Details |
| Name |
Accuracy of projections and inferences |
| Description |
This metric measures the proportion of projections or inferences that are later validated as accurate. This helps assess the reliability of predictive and inferential analysis. |
| Type |
Effectiveness |
| Data Required |
(N1) Number of projections or inferences evaluated
(N2) Number of those projections or inferences confirmed as accurate |
| Calculation |
N2 / N1 * 100 |
| Measure |
Percentage |
| Notes |
Accuracy may be determined through comparison with observed outcomes, subsequent analysis, or analyst review. Organizations should define criteria for validating projections or inferences before using this metric. |
8.2.1.3 Metric: Time to produce projections and inferences
| Metric Attribute |
Details |
| Name |
Time to produce projections and inferences |
| Description |
This metric measures the time required to produce projections or inferences after relevant data is available. Timely projections support proactive decision-making and help maintain an accurate situational picture. |
| Type |
Efficiency |
| Data Required |
(N1) Time at which sufficient data is available
(N2) Time at which projection or inference is produced |
| Calculation |
N2 - N1 |
| Measure |
Number |
| Notes |
This metric may be analysed using statistical methods such as median. Organizations should define what constitutes sufficient data and what constitutes completion of a projection or inference. |
8.2.2 Function: Event detection (through alerting and/or hunting)
Metrics: The following metrics are defined for this function:
- Time invested in threat hunting
- Threat hunting outcome in detections
8.2.2.1 Metric: Time invested in threat hunting
| Metric Attribute |
Details |
| Name |
Hours invested in threat hunting |
| Description |
This metric measures how much time a CSIRT is investing in threat hunting activities. |
| Type |
Efficiency |
| Implementation |
This metric can be tracked using time-tracking tools or manual logging. |
| Data Required |
(N1) Time (e.g., hours) spent threat hunting each period |
| Calculation |
N1 |
| Measure |
Number |
| Notes |
Consider defining what constitutes a threat hunt in your organisation. This metric can be analysed over time or by different types of threat hunting. This metric can also be used to determine the overall cost of this function. |
8.2.2.2 Metric: Threat hunting outcome in detections
| Metric Attribute |
Details |
| Name |
Threat hunting outcome in detections |
| Description |
This metric measures the proportion of detected events that are identified through proactive hunting activities rather than automated alerting. This helps assess the contribution of hunting to the current situational picture. |
| Type |
Effectiveness |
| Data Required |
(N1) Total number of events detected
(N2) Number of events detected through proactive hunting |
| Calculation |
N2 / N1 * 100 |
| Measure |
Percentage |
| Notes |
Proactive hunting should be defined by the organisation and may include hypothesis-driven searches, threat-informed hunts, or targeted investigations.
This metric should be interpreted carefully, as a lower value may reflect effective automated detection rather than ineffective hunting. |
Metrics: The following metric is defined for this function:
- Analysis outputs supporting incident management decisions
8.2.3.1 Metric: Analysis outputs supporting incident management decisions
| Metric Attribute |
Details |
| Name |
Analysis outputs supporting incident management decisions |
| Description |
This metric measures the proportion of analysis outputs that are used to support incident management decisions. This helps assess the usefulness of analysis in incident response. |
| Type |
Impact |
| Data Required |
(N1) Number of analysis outputs produced for incident management
(N2) Number of those outputs used to support incident management decisions |
| Calculation |
N2 / N1 * 100 |
| Measure |
Percentage |
| Notes |
Incident management decisions may include containment, mitigation, escalation, prioritization, or communications decisions. Organizations should define how decision support is documented. |
8.2.4 Function: Situational impact
Metrics: The following metric is defined for this function:
- Accuracy of impact assessments
8.2.4.1 Metric: Accuracy of impact assessments
| Metric Attribute |
Details |
| Name |
Accuracy of impact assessments |
| Description |
This metric measures the proportion of impact assessments that are later validated as accurate. This helps assess the quality of impact analysis. |
| Type |
Effectiveness |
| Data Required |
(N1) Number of impact assessments evaluated
(N2) Number of those assessments confirmed as accurate |
| Calculation |
N2 / N1 * 100 |
| Measure |
Percentage |
| Notes |
Validation may occur through later incident outcomes, operational review, or comparison with observed effects. Organizations should define criteria for accuracy and consider using sampling where full review is impractical. |
8.3 Service: Communication
8.3.1 Function: Internal and external communication
Metrics: The following metrics are defined for this function:
- Time to communicate situational information
- Coverage of relevant constituents in situational communication
- Situational communications containing recommended actions
| Metric Attribute |
Details |
| Name |
Time to communicate situational information |
| Description |
This metric measures the amount of time between when situational information has been assessed and approved for communication and when it is delivered to constituents. Timely communication ensures that constituents receive relevant information while it remains actionable and can take appropriate steps to improve their security or operational situation. |
| Type |
Efficiency |
| Data Required |
(N1) Time at which situational information was assessed and approved for communication
(N2) Time at which the situational communication was distributed |
| Calculation |
N2 - N1 |
| Measure |
Number |
| Notes |
This metric is most useful when analysed over time using statistical methods such as median. Analysis may be performed by communication type, severity, or audience to identify trends or delays. Delays may indicate bottlenecks in communication preparation, approval, or distribution processes. |
8.3.1.2 Metric: Coverage of relevant constituents in situational communication
| Metric Attribute |
Details |
| Name |
Coverage of relevant constituents in situational communication |
| Description |
This metric measures the proportion of identified constituent groups that receive situational communications relevant to them. Ensuring appropriate coverage helps confirm that constituents who need situational information receive it and can make informed decisions based on that information. |
| Type |
Effectiveness |
| Data Required |
(N1) Number of relevant constituent groups identified for a situational communication
(N2) Number of relevant constituent groups that received the communication |
| Calculation |
N2 / N1 * 100 |
| Measure |
Percentage |
| Notes |
Relevant constituent groups should be identified based on roles, responsibilities, exposure, or risk profile. This metric helps assess the effectiveness of communication distribution processes and identify potential gaps in communication coverage. |
8.3.1.3 Metric: Situational communications containing recommended actions
| Metric Attribute |
Details |
| Name |
Situational communications containing recommended actions |
| Description |
This metric measures the proportion of situational communications that include specific recommended actions for constituents. Providing recommended actions improves the usefulness of communication by helping constituents understand how to respond to the situational information provided. |
| Type |
Implementation |
| Data Required |
(N1) Total number of situational communications distributed
(N2) Number of situational communications containing recommended actions |
| Calculation |
N2 / N1 * 100 |
| Measure |
Percentage |
| Notes |
Recommended actions may include defensive measures, configuration changes, mitigation steps, or awareness guidance. Organizations should define what constitutes a recommended action based on their operational context and communication objectives. |
8.3.2 Function: Reporting and recommendations
Metrics: The following metrics are defined for this function:
- Situational reports containing recommendations
- Situational reports with supporting evidence documented
- Completeness of situational report documentation
8.3.2.1 Metric: Situational reports containing recommendations
| Metric Attribute |
Details |
| Name |
Situational reports containing recommendations |
| Description |
This metric measures the proportion of situational reports that include specific recommendations for constituents. Recommendations help constituents understand how to respond to the situational information provided and support informed decision-making regarding defensive measures, risk management, or operational changes. |
| Type |
Implementation |
| Data Required |
(N1) Total number of situational reports produced
(N2) Number of situational reports containing recommendations |
| Calculation |
N2 / N1 * 100 |
| Measure |
Percentage |
| Notes |
Not all situational reports may require recommendations. Organizations should define criteria for when recommendations are appropriate based on the purpose and audience of the report. This metric helps assess the extent to which reporting supports constituent decision-making. |
8.3.2.2 Metric: Situational reports with supporting evidence documented
| Metric Attribute |
Details |
| Name |
Situational reports with supporting evidence documented |
| Description |
This metric measures the proportion of situational reports that include documented evidence supporting the conclusions or recommendations presented. Providing supporting evidence improves transparency, strengthens confidence in the analysis, and allows constituents to evaluate the findings. |
| Type |
Effectiveness |
| Data Required |
(N1) Total number of situational reports produced
(N2) Number of situational reports containing supporting evidence |
| Calculation |
N2 / N1 * 100 |
| Measure |
Percentage |
| Notes |
Supporting evidence may include technical indicators, data sources, analytical findings, references, or other relevant information. Organizations should define what constitutes sufficient supporting evidence based on their operational context and reporting standards. |
8.3.2.3 Metric: Completeness of situational report documentation
| Metric Attribute |
Details |
| Name |
Completeness of situational report documentation |
| Description |
This metric measures the proportion of situational reports that include all required documentation elements necessary to communicate findings and conclusions effectively. Complete reporting helps ensure constituents receive sufficient context to understand the situational picture and make informed decisions. |
| Type |
Effectiveness |
| Data Required |
(N1) Number of situational reports reviewed
(N2) Number of situational reports containing all required documentation elements |
| Calculation |
N2 / N1 * 100 |
| Measure |
Percentage |
| Notes |
Required documentation elements should be defined by the organisation and may include analysis results, conclusions, supporting context, and relevant background information. This metric may be measured through quality review or sampling processes. |
8.3.3 Function: Implementation
Metrics: The following metrics are defined for this function:
- Recommended actions implemented by constituents
- Time to implement recommended actions
8.3.3.1 Metric: Recommended actions implemented by constituents
| Metric Attribute |
Details |
| Name |
Recommended actions implemented by constituents |
| Description |
This metric measures the proportion of recommended actions arising from situational communications that are implemented by constituents. This helps assess whether situational awareness activities result in tangible defensive improvements. |
| Type |
Impact |
| Data Required |
(N1) Total number of recommended actions communicated to constituents
(N2) Number of recommended actions implemented by constituents |
| Calculation |
N2 / N1 * 100 |
| Measure |
Percentage |
| Notes |
Implementation may include configuration changes, deployment of defensive controls, or procedural adjustments. This metric may require coordination with constituents to track implementation status and should not be used as a key performance indicator of the CSIRT. |
8.3.3.2 Metric: Time to implement recommended actions
| Metric Attribute |
Details |
| Name |
Time to implement recommended actions |
| Description |
This metric measures the amount of time between when recommended actions are communicated and when they are implemented. Timely implementation helps reduce exposure to identified threats and improves defensive readiness. |
| Type |
Efficiency |
| Data Required |
(N1) Time at which recommended action was communicated
(N2) Time at which recommended action was implemented |
| Calculation |
N2 – N1 |
| Measure |
Number |
| Notes |
This metric is most useful when analysed using statistical methods such as median. Analysis may be performed by action type, severity, or constituent group.
This metric may require coordination with constituents to track implementation status and should not be used as a key performance indicator of the CSIRT. |
Metrics: The following metrics are defined for this function:
- Dissemination of situational awareness outputs to defined targets
- Integration of situational awareness into operational processes
- Tracking of situational information sharing
8.3.4.1 Metric: Dissemination of situational awareness outputs to defined targets
| Metric Attribute |
Details |
| Name |
Dissemination of situational awareness outputs to defined targets |
| Description |
This metric measures the proportion of situational awareness outputs that are shared with all identified internal and external targets. Effective dissemination ensures that relevant information reaches the appropriate audiences for further use in decision-making and operational processes. |
| Type |
Effectiveness |
| Data Required |
(N1) Number of situational awareness outputs with defined target recipients
(N2) Number of those outputs successfully disseminated to all defined targets |
| Calculation |
N2 / N1 * 100 |
| Measure |
Percentage |
| Notes |
Targets may include internal teams, constituents, trusted partners, or external communities.
Organizations should define what constitutes successful dissemination based on their communication and sharing mechanisms. |
8.3.4.2 Metric: Integration of situational awareness into operational processes
| Metric Attribute |
Details |
| Name |
Integration of situational awareness into operational processes |
| Description |
This metric measures the extent to which situational awareness outputs are incorporated into operational processes such as threat hunting, incident detection, incident response, or other decision-making activities. Integration ensures that situational awareness contributes to improving security operations. |
| Type |
Impact |
| Data Required |
(N1) Number of situational awareness outputs produced
(N2) Number of outputs incorporated into operational processes |
| Calculation |
N2 / N1 * 100 |
| Measure |
Percentage |
| Notes |
Integration may include use in detection rules, playbooks, threat intelligence platforms, or other operational workflows.
Organizations should define criteria for when an output is considered integrated. |
| Metric Attribute |
Details |
| Name |
Tracking of situational information sharing |
| Description |
This metric measures the proportion of situational awareness outputs for which dissemination activities are tracked and recorded. Tracking supports visibility into how information is shared and enables reporting, auditing, and improvement of information sharing practices. |
| Type |
Implementation |
| Data Required |
(N1) Total number of situational awareness outputs produced
(N2) Number of outputs with documented dissemination or sharing records |
| Calculation |
N2 / N1 * 100 |
| Measure |
Percentage |
| Notes |
Tracking may include logs of distribution, sharing platform records, or other documentation.
This metric helps ensure that information sharing processes are observable and manageable. |
Metrics: The following metrics are defined for this function:
- Information sharing transfers containing required information
- Tracked information sharing transfers successfully received
| Metric Attribute |
Details |
| Name |
Information sharing transfers containing required information |
| Description |
This metric measures the proportion of information sharing transfers that include all required information elements. Ensuring that the necessary information is included supports effective sharing and helps recipients understand and use the information provided. |
| Type |
Effectiveness |
| Data Required |
(N1) Number of information sharing transfers reviewed
(N2) Number of reviewed transfers containing all required information elements |
| Calculation |
N2 / N1 * 100 |
| Measure |
Percentage |
| Notes |
Required information elements should be defined by the organisation and may vary based on the audience, sharing purpose, or transfer mechanism. This metric may be assessed through quality review or sampling processes. |
| Metric Attribute |
Details |
| Name |
Tracked information sharing transfers successfully received |
| Description |
This metric measures the proportion of tracked information sharing transfers that are confirmed as successfully received by the intended recipients. This helps assess whether information sharing processes are functioning reliably and whether shared information is reaching the intended audience. |
| Type |
Efficiency |
| Data Required |
(N1) Number of tracked information sharing transfers performed
(N2) Number of tracked transfers confirmed as successfully received |
| Calculation |
N2 / N1 * 100 |
| Measure |
Percentage |
| Notes |
Confirmation may include automated delivery confirmation, acknowledgement by recipients, or system records indicating successful receipt.
Organizations should define what constitutes successful receipt based on the transfer mechanism and operational context. |
8.3.6 Function: Feedback
Metrics: The following metrics are defined for this function:
- Feedback received from constituencies
- Feedback addressing information quality or usefulness
8.3.6.1 Metric: Feedback received from constituencies
| Metric Attribute |
Details |
| Name |
Feedback received from constituencies |
| Description |
The metric tracks the rate of feedback from constituencies and is useful for tracking responses where feedback is required. |
| Type |
Implementation |
| Data Required |
(N1) Number of information items or information-sharing interactions identified as requiring feedback
(N2) Number of those items or interactions for which feedback was received |
| Calculation |
N2 / N1 * 100 |
| Measure |
Percentage |
| Notes |
Organizations should define criteria for when feedback is required. Feedback may be provided to internal teams, constituents, partners, or other external sources. |
| Metric Attribute |
Details |
| Name |
Feedback addressing information quality or usefulness |
| Description |
This metric measures the proportion of feedback that addresses one or more relevant quality or usefulness attributes of the information received. |
| Type |
Effectiveness |
| Data Required |
(N1) Number of feedback instances reviewed
(N2) Number of reviewed feedback instances that address defined information quality or usefulness attributes |
| Calculation |
N2 / N1 * 100 |
| Measure |
Percentage |
| Notes |
Quality or usefulness attributes may include accuracy, applicability, timeliness, novelty, strategic relevance, or value in supporting investigations or decision-making. Organizations should define which attributes are relevant in their operational context. |
9 Service Area: Knowledge Transfer
9.1 Service: Awareness building
Metrics: The following metrics are defined for this function:
- None; no metrics are defined for this function.
9.1.2 Function: Reports and awareness materials development
Metrics: The following metrics are defined for this function:
- Reports and materials developed
- Time spent developing awareness materials
9.1.2.1 Metric: Reports and awareness materials developed
| Metric Attribute |
Details |
| Name |
Reports and materials developed |
| Description |
This metric measures how many reports and awareness materials are developed |
| Type |
Implementation |
| Data Required |
(N1) Number of Reports and awareness materials developed |
| Calculation |
N1 |
| Measure |
Number |
| Notes |
A variation could also be to count by category (i.e. such as presentations, short videos, cartoons, booklets, technical analysis, trend reports, and annual reports). |
9.1.2.2 Metric: Time spent developing awareness materials
| Metric Attribute |
Details |
| Name |
Time spent developing awareness materials |
| Description |
Developing awareness material is a time-consuming task that needs prioritisation and investment. To make this investment transparent, measure the time spent. |
| Type |
Efficiency |
| Data Required |
(N1) Amount of time spent on developing awareness materials |
| Calculation |
N1 |
| Measure |
Number |
| Notes |
Consider calculating the cost from the time spent. |
Metrics: The following metric is defined for this function:
- Count of information disseminated
| Metric Attribute |
Details |
| Name |
Count of information disseminated |
| Description |
This metric measures how many unique information disseminations were executed. |
| Type |
Efficiency |
| Data Required |
(N1) Number of unique information disseminations |
| Calculation |
N1 |
| Measure |
Number |
| Notes |
A variation could also be to count by category (i.e. podcasts, blog posts, social media posts and videos, press releases, advertisements, campaigns, public reports, etc). Consider calculating hours invested or the cost from the hours spent. |
9.1.4 Function: Outreach
Metrics: The following metrics are defined for this function:
- Outreach program investment
- Outreach target completion
9.1.4.1 Metric: Outreach program investment
| Metric Attribute |
Details |
| Name |
Outreach program investment |
| Description |
Maintaining continuous outreach activities takes effort. We can measure how much is invested in said effort to make this investment transparent and spot trends. |
| Type |
Implementation |
| Data Required |
(N1) Money spent on outreach |
| Calculation |
N1 |
| Measure |
Number |
| Notes |
Might argue that it is also an implementation metric as it has a monetary value. |
9.1.4.2 Metric: Outreach target completion
| Metric Attribute |
Details |
| Name |
Outreach target completion |
| Description |
How much are we fulfilling our outreach targets? We can answer this question by aggregating the fulfilment rate of each outreach target. Outreach activities can include but are not limited to meeting with key stakeholders, participating in sector meetings, presenting at conferences, and organizing conferences. |
| Type |
Effectiveness |
| Data Required |
For each outreach activity
(N1) Outreach target
(N2) Outreach activity
Now aggregate and mean completion percentages by adding them and dividing by total number of targets. |
| Calculation |
∑(P1,Pn) / count(P) *100 |
| Measure |
Mean |
| Notes |
Might argue that it is also an implementation metric as it has a monetary value. |
9.2 Service: Training and education
9.2.1 Function: Knowledge, skill, and ability requirements gathering
Metrics: The following metrics are defined for this function:
- Coverage of roles with defined KSA requirements
- Consistent timely updating of KSA requirements
9.2.1.1 Metric: Coverage of roles with defined KSA requirements
| Metric Attribute |
Details |
| Name |
Coverage of roles with defined KSA requirements |
| Description |
This metric measures the proportion of constituent roles that are included within the defined KSA framework. Broad coverage helps ensure that training and education efforts address the full range of required capabilities across the constituency. |
| Type |
Effectiveness |
| Data Required |
(N1) Total number of constituent roles identified
(N2) Number of roles included within the defined KSA framework |
| Calculation |
N2 / N1 * 100 |
| Measure |
Percentage |
| Notes |
This metric complements the definition of KSA requirements by ensuring that all relevant roles are considered. Organizations should define the scope of roles included in the constituency. |
9.2.1.2 Metric: Consistent timely updating of KSA requirements
| Metric Attribute |
Details |
| Name |
Consistent timely updating of KSA requirements |
| Description |
This metric measures the proportion of defined KSA requirements that have been reviewed and updated within a defined period. Maintaining current KSA requirements helps ensure that training programs reflect evolving threats, technologies, and operational practices. |
| Type |
Implementation |
| Data Required |
(N1) Number of defined KSA requirement sets
(N2) Number of those requirement sets reviewed or updated within the defined period |
| Calculation |
N2 / N1 * 100 |
| Measure |
Percentage |
| Notes |
Organizations should define the review interval based on their operational context. Reviews may include updates based on changes in threat landscape, tools, or organisational priorities |
9.2.2 Function: Educational and training materials development
Metrics: The following metrics are defined for this function:
- Training materials aligned to defined KSA requirements
- Availability of training materials for defined topics or roles
- Consistent and timely updates to training material
9.2.2.1 Metric: Training materials aligned to defined KSA requirements
| Metric Attribute |
Details |
| Name |
Training materials aligned to defined KSA requirements |
| Description |
This metric measures the proportion of training materials that are aligned to defined knowledge, skill, and ability (KSA) requirements. Alignment ensures that developed materials support the capabilities identified as necessary for the constituency. |
| Type |
Implementation |
| Data Required |
(N1) Total number of training materials developed
(N2) Number of training materials aligned to defined KSA requirements |
| Calculation |
N2 / N1 * 100 |
| Measure |
Percentage |
| Notes |
Alignment may be determined through mapping materials to defined roles, competencies, or capability frameworks. Organizations should define how alignment is assessed. |
9.2.2.2 Metric: Availability of training materials for defined topics or roles
| Metric Attribute |
Details |
| Name |
Availability of training materials for defined topics or roles |
| Description |
This metric measures the proportion of defined training topics or roles for which training materials are available. Ensuring availability helps confirm that the training program can support the required knowledge and skill areas across the constituency. |
| Type |
Effectiveness |
| Data Required |
(N1) Number of defined training topics or roles requiring materials
(N2) Number of those topics or roles with available training materials |
| Calculation |
N2 / N1 * 100 |
| Measure |
Percentage |
| Notes |
Topics or roles should be derived from KSA requirements. Materials may include documentation, course content, exercises, or other educational resources. |
9.2.2.3 Metric: Consistent and timely updates to training materials
| Metric Attribute |
Details |
| Name |
Consistent and timely updates to training materials |
| Description |
This metric measures the proportion of training materials that have been reviewed and updated within a defined period. Maintaining current materials helps ensure that training reflects evolving threats, technologies, and practices. |
| Type |
Effectiveness |
| Data Required |
(N1) Number of training materials
(N2) Number of training materials reviewed or updated within the defined period |
| Calculation |
N2 / N1 * 100 |
| Measure |
Percentage |
| Notes |
Organizations should define the review interval based on their operational context. Updates may include changes due to new threats, tools, processes, or lessons learned from incidents. |
9.2.3 Function: Content delivery
Metrics: The following metrics are defined for this function:
- Participation in training and education activities
- Coverage of target audience in training delivery
- Training and education activities delivered as planned
9.2.3.1 Metric: Participation in training and education activities
| Metric Attribute |
Details |
| Name |
Participation in training and education activities |
| Description |
This metric measures the proportion of invited or expected participants who attend or complete training and education activities. Participation helps ensure that training efforts reach the intended audience and contribute to capability development. |
| Type |
Effectiveness |
| Data Required |
(N1) Number of individuals invited or expected to participate in training activities
(N2) Number of individuals who participated in or completed those activities |
| Calculation |
N2 / N1 * 100 |
| Measure |
Percentage |
| Notes |
Participation may include attendance at live sessions, completion of online modules, or engagement in exercises. Organizations should define what constitutes participation based on their delivery methods. |
9.2.3.2 Metric: Coverage of target audience in training delivery
| Metric Attribute |
Details |
| Name |
Coverage of target audience in training delivery |
| Description |
This metric measures the proportion of the defined target audience that receives training over a given period. Broad coverage helps ensure that training is distributed across the constituency and supports consistent capability development. |
| Type |
Implementation |
| Data Required |
(N1) Number of individuals or groups identified as requiring training
(N2) Number of those individuals or groups who received training within the defined period |
| Calculation |
N2 / N1 * 100 |
| Measure |
Percentage |
| Notes |
This metric may be measured over a defined time interval such as quarterly or annually. It complements participation metrics by focusing on overall reach rather than individual events. |
9.2.3.3 Metric: Training and education activities delivered as planned
| Metric Attribute |
Details |
| Name |
Training and education activities delivered as planned |
| Description |
This metric measures the proportion of planned training and education activities that are delivered within a defined period. Delivering planned activities helps ensure that the training program is executed as intended. |
| Type |
Implementation |
| Data Required |
(N1) Number of training and education activities planned for the period
(N2) Number of those activities that were delivered |
| Calculation |
N2 / N1 * 100 |
| Measure |
Percentage |
| Notes |
Planned activities may include courses, workshops, exercises, or awareness sessions. Organizations should define what constitutes delivery, including criteria for completion or acceptable deviation from plan. |
9.2.4 Function: Mentoring
Metrics: The following metrics are defined for this function:
- Participation in mentoring activities
- Active mentoring relationships
- Mentoring contributing to capability development
9.2.4.1 Metric: Participation in mentoring activities
| Metric Attribute |
Details |
| Name |
Participation in mentoring activities |
| Description |
This metric measures the proportion of identified individuals who participate in mentoring activities. Participation helps ensure that mentoring opportunities are being utilized to support capability development within the constituency. |
| Type |
Effectiveness |
| Data Required |
(N1) Number of individuals identified as candidates for mentoring
(N2) Number of those individuals participating in mentoring activities |
| Calculation |
N2 / N1 * 100 |
| Measure |
Percentage |
| Notes |
Mentoring activities may include one-on-one mentoring, group mentoring, coaching sessions, or informal guidance. Organizations should define what constitutes participation based on their mentoring model. |
9.2.4.2 Metric: Active mentoring relationships
| Metric Attribute |
Details |
| Name |
Active mentoring relationships |
| Description |
This metric measures the proportion of established mentoring relationships that are active over a defined period. Active mentoring relationships indicate sustained engagement and ongoing support for capability development. |
| Type |
Effectiveness |
| Data Required |
(N1) Number of mentoring relationships established
(N2) Number of mentoring relationships active during the defined period |
| Calculation |
N2 / N1 * 100 |
| Measure |
Percentage |
| Notes |
Organizations should define what constitutes an active mentoring relationship, such as regular interaction or engagement within a defined timeframe. |
9.2.4.3 Metric: Mentoring contributing to capability development
| Metric Attribute |
Details |
| Name |
Mentoring contributing to capability development |
| Description |
This metric measures the proportion of mentoring activities or relationships that result in demonstrated improvement in participant capability. This helps assess the effectiveness of mentoring in supporting skill and knowledge development. |
| Type |
Impact |
| Data Required |
(N1) Number of mentoring relationships or activities evaluated
(N2) Number of those relationships or activities demonstrating improvement in participant capability |
| Calculation |
N2 / N1 * 100 |
| Measure |
Percentage |
| Notes |
Capability improvement may be assessed through performance evaluations, demonstrated skill progression, or other assessment methods. Organizations should define how improvement is measured based on their operational context.
The percentage method defined here using a binary assessment of demonstrated participant improvement. This allows for a variety of assessments. An alternate method would be to survey participants using a numeric mentoring effectiveness scale for evaluation. |
9.2.5 Function: CSIRT staff professional development
Metrics: The following metrics are defined for this function:
- Participation of CSIRT staff in professional development activities
- CSIRT staff professional development aligned to defined KSA requirements
- Improvement in CSIRT staff capability following professional development
- Percentage of staff meeting KSA requirements
9.2.5.1 Metric: Participation of CSIRT staff in professional development activities
| Metric Attribute |
Details |
| Name |
Participation of CSIRT staff in professional development activities |
| Description |
This metric measures the proportion of CSIRT staff who participate in professional development activities. Participation helps ensure that staff maintain and enhance the knowledge and skills required to perform their roles effectively. |
| Type |
Effectiveness |
| Data Required |
(N1) Number of CSIRT staff identified for professional development
(N2) Number of those staff who participated in professional development activities |
| Calculation |
N2 / N1 * 100 |
| Measure |
Percentage |
| Notes |
Professional development activities may include formal training, certifications, conferences, workshops, or other learning opportunities. Organizations should define what constitutes participation based on their development programs. |
9.2.5.2 Metric: CSIRT staff professional development aligned to defined KSA requirements
| Metric Attribute |
Details |
| Name |
CSIRT staff professional development aligned to defined KSA requirements |
| Description |
This metric measures the proportion of professional development activities that are aligned to defined knowledge, skill, and ability (KSA) requirements for CSIRT staff. Alignment helps ensure that development efforts support the capabilities required for effective incident management and security operations. |
| Type |
Effectiveness |
| Data Required |
(N1) Total number of professional development activities undertaken by CSIRT staff
(N2) Number of those activities aligned to defined KSA requirements |
| Calculation |
N2 / N1 * 100 |
| Measure |
Percentage |
| Notes |
Alignment may be determined by mapping development activities to defined roles, competencies, or capability frameworks. Organizations should define how alignment is assessed. |
9.2.5.3 Metric: Improvement in CSIRT staff capability following professional development
| Metric Attribute |
Details |
| Name |
Improvement in CSIRT staff capability following professional development |
| Description |
This metric measures the proportion of professional development activities that result in demonstrated improvement in CSIRT staff capability. This helps assess whether professional development contributes to enhancing the effectiveness of the CSIRT. |
| Type |
Impact |
| Data Required |
(N1) Number of professional development activities evaluated
(N2) Number of those activities demonstrating improvement in staff capability |
| Calculation |
N2 / N1 * 100 |
| Measure |
Percentage |
| Notes |
Capability improvement may be assessed through performance evaluations, skill assessments, certifications achieved or demonstrated improvements in operational performance. Organizations should define how improvement is measured. |
9.2.5.4 Metric: Percentage of staff meeting KSA requirements
| Metric Attribute |
Details |
| Name |
Percentage of staff meeting KSA requirements |
| Description |
The purpose of this metric is to measure the effectiveness of a CSIRT's development program against its needs. This can help identify KSA or KSA requirement drift, identify opportunities for bulk learning or missing funding, etc.
We aim to do this by measuring how well the knowledge, skills and abilities of our staff meet the requirements. |
| Type |
Effectiveness |
| Data Required |
(N1) Total number of staff
(N2) Number of staff meeting KSA requirements |
| Calculation |
(N2 / N1) * 100 |
| Measure |
Percentage |
| Difficulty / Barriers |
| Notes |
You can do variations of this metric for specific roles, teams or career bands.
There should still be enough flexibility in your assessment model to allow for diversity in KSA. For instance, minimum requirement combined with a flexible secondary skill tier.
Some level of qualitative data is to be expected if you don't base all your data points on formal training and certification which is also an option. |
9.3 Service: Exercises
9.3.0 Exercises: Service metrics
Each function within this service has associated metrics. In addition, one service level metric for the Exercise service, designed to provide insight into the overall value of this service. The functional metrics are designed to ensure the specifics of each function are implemented or executed properly.
The following program metric is included in this Service Area
- Coverage of defined capabilities in exercises
9.3.0.1 Metric: Coverage of defined capabilities in exercises
| Metric Attribute |
Details |
| Name |
Coverage of defined capabilities in exercises |
| Description |
This metric measures the proportion of defined organisational capabilities or services that are exercised over a defined period. This helps ensure that the exercise program provides coverage across the full range of required capabilities and identifies gaps in testing. |
| Type |
Effectiveness |
| Data Required |
(N1) Number of defined capabilities or services requiring exercise coverage
(N2) Number of those capabilities or services exercised within the defined period |
| Calculation |
N2 / N1 * 100 |
| Measure |
Percentage |
| Notes |
Capabilities may include incident response functions, tools, processes, or KSAs. This metric is typically measured over a defined period such as annually to reflect exercise planning cycles. |
9.3.1 Function: Requirements analysis
Metrics: The following metric is defined for this function:
- Alignment of exercise objectives to defined capabilities
9.3.1.1 Metric: Alignment of exercise objectives to defined capabilities
| Metric Attribute |
Details |
| Name |
Alignment of exercise objectives to defined capabilities |
| Description |
This metric measures the proportion of exercises whose objectives are aligned to defined organisational capabilities or requirements. Alignment helps ensure that exercises are relevant and support capability development. |
| Type |
Effectiveness |
| Data Required |
(N1) Number of exercises conducted
(N2) Number of exercises aligned to defined capabilities |
| Calculation |
N2 / N1 * 100 |
| Measure |
Percentage |
| Notes |
Capabilities may include incident response functions, tools, or KSAs defined elsewhere in the organisation. |
Metrics: The following metrics are defined for this function:
- Exercises with defined format and environment
- Exercises with required resources prepared
| Metric Attribute |
Details |
| Name |
Exercises with defined format and environment |
| Description |
This metric measures the proportion of exercises for which the format and environment are defined prior to execution. Defining format and environment helps ensure that exercises meet their intended objectives. |
| Type |
Implementation |
| Data Required |
(N1) Number of exercises conducted
(N2) Number of exercises with defined format and environment |
| Calculation |
N2 / N1 * 100 |
| Measure |
Percentage |
| Notes |
Formats may include table-top, simulation, or hands-on exercises. The environment may include platforms, tools, or infrastructure. |
9.3.2.2 Metric: Exercises with required resources prepared
| Metric Attribute |
Details |
| Name |
Exercises with required resources prepared |
| Description |
This metric measures the proportion of exercises for which required resources and infrastructure are prepared prior to execution. Proper preparation supports successful execution of the exercise. |
| Type |
Effectiveness |
| Data Required |
(N1) Number of exercises conducted
(N2) Number of exercises with required resources prepared |
| Calculation |
N2 / N1 * 100 |
| Measure |
Percentage |
| Notes |
Resources may include personnel, tools, environments, and supporting materials. |
9.3.3 Function: Scenario development
Metrics: The following metrics are defined for this function:
- Exercises with defined scenarios and injects
- Scenarios aligned to exercise objectives
9.3.3.1 Metric: Exercises with defined scenarios and injects
| Metric Attribute |
Details |
| Name |
Exercises with defined scenarios and injects |
| Description |
This metric measures the proportion of exercises that include defined scenarios and injects. Well-defined scenarios help ensure exercises are structured and effective. |
| Type |
Implementation |
| Data Required |
(N1) Number of exercises conducted
(N2) Number of exercises with defined scenarios and injects |
| Calculation |
N2 / N1 * 100 |
| Measure |
Percentage |
| Notes |
Injects may include simulated events, data inputs, or prompts used to guide participants through the exercise. |
9.3.3.2 Metric: Scenarios aligned to exercise objectives
| Metric Attribute |
Details |
| Name |
Scenarios aligned to exercise objectives |
| Description |
This metric measures the proportion of exercise scenarios that are aligned to defined objectives. Alignment ensures that scenarios effectively test the intended capabilities. |
| Type |
Effectiveness |
| Data Required |
(N1) Number of scenarios reviewed
(N2) Number of scenarios aligned to exercise objectives |
| Calculation |
N2 / N1 * 100 |
| Measure |
Percentage |
| Notes |
Alignment may be assessed through mapping scenarios to objectives defined in requirements analysis. |
9.3.4 Function: Exercise execution
Metrics: The following metrics are defined for this function:
- Exercises executed as planned
- Participation in exercise activities
9.3.4.1 Metric: Exercises executed as planned
| Metric Attribute |
Details |
| Name |
Exercises executed as planned |
| Description |
This metric measures the proportion of exercises that are executed according to the defined plan. Successful execution helps ensure that exercise objectives are met. |
| Type |
Implementation |
| Data Required |
(N1) Number of exercises conducted
(N2) Number of exercises executed as planned |
| Calculation |
N2 / N1 * 100 |
| Measure |
Percentage |
| Notes |
Execution as planned may include adherence to schedule, scenario progression, and participant involvement. |
9.3.4.2 Metric: Participation in exercise activities
| Metric Attribute |
Details |
| Name |
Participation in exercise activities |
| Description |
This metric measures the proportion of invited participants who take part in exercises. Participation helps ensure that exercises effectively engage the intended audience. |
| Type |
Effectiveness |
| Data Required |
(N1) Number of participants invited
(N2) Number of participants who participated |
| Calculation |
N2 / N1 * 100 |
| Measure |
Percentage |
| Notes |
Participation may include active engagement during the exercise or completion of assigned tasks. |
9.3.5 Function: Exercise outcome review
Metrics: The following metric is defined for this function:
- Exercises with documented after-action reports
9.3.5.1 Metric: Exercises with documented after-action reports
| Metric Attribute |
Details |
| Name |
Exercises with documented after-action reports |
| Description |
This metric measures the proportion of exercises that result in a documented after-action report. Documentation helps capture lessons learned and supports continuous improvement. |
| Type |
Implementation |
| Data Required |
(N1) Number of exercises conducted
(N2) Number of exercises with documented after-action reports |
| Calculation |
N2 / N1 * 100 |
| Measure |
Percentage |
| Notes |
Reports may include findings, lessons learned, and recommendations. |
9.4 Service: Technical and policy advisory
9.4.1 Function: Risk management support
Metrics: The following metric is defined for this function:
- CSIRT recommendations incorporated into risk management decisions
9.4.1.1 Metric: CSIRT recommendations incorporated into risk management decisions
| Metric Attribute |
Details |
| Name |
CSIRT recommendations incorporated into risk management decisions |
| Description |
This metric measures the proportion of CSIRT recommendations that are incorporated into risk management decisions or outcomes. This helps assess the influence of CSIRT advisory activities. |
| Type |
Impact |
| Data Required |
(N1) Number of CSIRT recommendations provided for risk management activities
(N2) Number of those recommendations incorporated into decisions |
| Calculation |
N2 / N1 * 100 |
| Measure |
Percentage |
| Notes |
Incorporation may include acceptance, implementation, or formal acknowledgment in risk treatment plans. |
9.4.2 Function: Business continuity and disaster recovery planning support
Metrics: The following metric is defined for this function:
- CSIRT recommendations incorporated into BC/DR plans
9.4.2.1 Metric: CSIRT recommendations incorporated into BC/DR plans
| Metric Attribute |
Details |
| Name |
CSIRT recommendations incorporated into BC/DR plans |
| Description |
This metric measures the proportion of CSIRT recommendations that are incorporated into business continuity and disaster recovery plans. This helps assess the effectiveness of advisory input. |
| Type |
Impact |
| Data Required |
(N1) Number of CSIRT recommendations provided for BC/DR planning
(N2) Number of those recommendations incorporated into plans |
| Calculation |
N2 / N1 * 100 |
| Measure |
Percentage |
| Notes |
Incorporation may include updates to recovery strategies, procedures, or alignment with incident management practices. |
9.4.3 Function: Policy support
Metrics: The following metric is defined for this function:
- CSIRT recommendations incorporated into policies
9.4.3.1 Metric: CSIRT recommendations incorporated into policies
| Metric Attribute |
Details |
| Name |
CSIRT recommendations incorporated into policies |
| Description |
This metric measures the proportion of CSIRT recommendations that are incorporated into policies. This helps assess the influence of CSIRT advisory activities on governance. |
| Type |
Impact |
| Data Required |
(N1) Number of CSIRT recommendations provided for policy development
(N2) Number of those recommendations incorporated into policies |
| Calculation |
N2 / N1 * 100 |
| Measure |
Percentage |
| Notes |
Incorporation may include adoption of controls, processes, or incident management requirements. |
9.4.4 Function: Technical advice
Metrics: The following metric is defined for this function:
- CSIRT technical recommendations implemented
9.4.4.1 Metric: CSIRT technical recommendations implemented
| Metric Attribute |
Details |
| Name |
CSIRT technical recommendations implemented |
| Description |
This metric measures the proportion of CSIRT technical recommendations that are implemented. This helps assess the effectiveness and influence of technical advisory activities. |
| Type |
Impact |
| Data Required |
(N1) Number of CSIRT technical recommendations provided
(N2) Number of those recommendations implemented |
| Calculation |
N2 / N1 * 100 |
| Measure |
Percentage |
| Notes |
Implementation may include changes to systems, tools, configurations, or processes. |
ANNEX 1: Acknowledgements
- Peter Aarhus (Head of Cyber Defence Centre), CDC, Ørsted (DK)
- Vilius Benetis, NRD CIRT (LT)
- Leandro Rocha, (Security Engineer), Threat Detection, Nubank (BR)
- Rômulo Rocha (Lead Information Security Engineer), Nubank (BR)
- Sigitas Rokas, NRD CIRT (LT)
- Robin M. Ruefle (Co-Service Area Coordinator), CERT/CC, SEI, CMU (US)
- Désirée Sacher-Boldewin (Head of Operational IT Security), Finanz Informatik (DE)
- Logan Wilkins (Sr. Manager, Engineering), CSIRT, Cisco (US)
- Mark Zajicek (Co-Service Area Coordinator), CERT/CC, SEI, CMU (US)
ANNEX 2: Terms and Definitions
-
Alert – A notification generated by a detection mechanism indicating a potential security event or security incident.
-
Artefact – A digital object or data item collected during incident response or analysis, such as a file, memory image, network capture, or log extract.
-
Capability – A measurable activity that may be performed as part of an organisation's roles and responsibilities. For the purposes of the FIRST services framework, the capabilities can either be defined as the broader services or as the requisite functions.
-
Capacity – The number of simultaneous process-occurrences of a particular capability that an organisation can execute before they achieve some form of resource exhaustion.
-
Chain of custody – The documented process that ensures the integrity and authenticity of data or artefacts from collection through analysis and potential legal use.
-
Constituent – An individual, group, or organisation that is served by, or otherwise relies on, the CSIRT.
-
Containment – Actions taken to limit the spread or impact of a security incident.
-
Coverage – The extent to which controls, detection mechanisms, or services address identified threats, assets, or requirements.
-
Data required – The discrete data elements necessary to calculate or understand a metric, listed within each metric definition and reset per metric.
-
Dynamic (runtime) analysis – Analysis of an artefact by executing it in a controlled environment to observe its behaviour.
-
Efficiency metric – A metric that examines timeliness or resource utilization, including how quickly activities are performed and issues are addressed.
-
Effectiveness metric – A metric that evaluates how well a service, function, or control achieves its intended outcome.
-
False positive – An alert, detection, or reported condition that is determined not to represent malicious or relevant activity.
-
Function – An activity or set of activities aimed at fulfilling the purpose of a particular service.
-
Impact metric – A metric that articulates the effect of information security activities on organisational mission, goals, objectives, or value.
-
Implementation metric – A metric that demonstrates the presence, completeness, or progress of controls, processes, or capabilities.
-
Indicator of compromise (IOC) – A piece of information associated with an incident that can be used to identify potentially malicious activity, such as IP addresses, domains, file hashes, registry keys, or process names.
-
Measure – The form of the metric result, such as Percentage, Mean, Median, Number, or Ratio.
-
Metric – A quantitative or qualitative measurement used to assess the performance, effectiveness, efficiency, coverage, or impact of a CSIRT service or function.
-
Metric type – A classification describing the primary intent of a metric, used to indicate what aspect of a service or function is being measured.
-
Recovery – Actions taken to restore systems and services to normal operation following a security incident.
-
Root cause – The underlying reason why a security incident occurred, beyond immediate symptoms or indicators.
-
Security event – An observable occurrence in a system or network that may indicate a security-relevant condition.
-
Security incident – A security event or series of events that has been determined to have a negative impact on confidentiality, integrity, or availability.
-
Service – A set of recognizable, coherent functions oriented toward a specific result that may be expected or required by constituents or stakeholders.
-
Service area – A grouping of services related to a common aspect, used to organize services at a top level to facilitate understanding and communication.
-
Situational awareness – An understanding of the current state of incidents, threats, and response activities sufficient to support effective decision-making.
-
Stakeholder – An individual or organisation that has an interest in the CSIRT's services, performance, or outcomes, but may not directly receive services.
-
Static analysis – Analysis of an artefact without executing it, such as examining file structure, metadata, or code.
-
Triage – The process of reviewing, categorizing, and prioritizing events, alerts, or incidents to determine appropriate handling.
-
True positive – An alert, detection, or reported condition that correctly identifies malicious or relevant activity.
-
Vulnerability – A weakness in a system, service, or configuration that could be exploited to compromise security.
-
Vulnerability disclosure – The process of communicating information about vulnerabilities to affected parties, vendors, or the public.
ANNEX 3: Supporting Resources
-
Asana.org
Story points: Estimation guide for user stories in Agile
https://asana.com/resources/story-points
-
FIRST.org
CSIRT Services Framework v2.1. Forum of Incident Response and Security Teams (FIRST), 2023.
https://www.first.org/standards/frameworks/csirt-services
-
FIRST.org
Service Incident Timing Metrics v1. Forum of Incident Response and Security Teams (FIRST), 2023.
https://www.first.org/global/sigs/metrics/Security-Incident-Timing-Metrics_v1.0.pdf
-
ISO/IEC 30111:2019
Information technology – Security techniques – Vulnerability handling processes, International Organisation for Standardization
-
ISO/IEC 29147:2018
Information technology – Security techniques – Vulnerability disclosure. International Organisation for Standardization
-
NIST SP 800-61 Rev. 2
Computer Security Incident Handling Guide. National Institute of Standards and Technology (NIST), 2012
-
NIST SP 800-55v1
Measurement Guide for Information Security - Volume 1, Identifying and Selecting Measures, National Institute of Standards and Technology (NIST), 2024
-
NIST SP 800-115
Technical Guide to Information Security Testing and Assessment. NIST, 2008
-
NIST NVD (National Vulnerability Database)
https://nvd.nist.gov/
-
Common Vulnerability Scoring System (CVSS) v3.1
FIRST.org
https://www.first.org/cvss/
-
CERT/CC
Vulnerability Disclosure Policy. Carnegie Mellon University Software Engineering Institute
https://www.kb.cert.org/vuls/html/disclosure
-
ENISA
Coordinated Vulnerability Disclosure Guidelines. European Union Agency for Cybersecurity, 2018
https://www.enisa.europa.eu/publications/coordinated-vulnerability-disclosure-guidelines
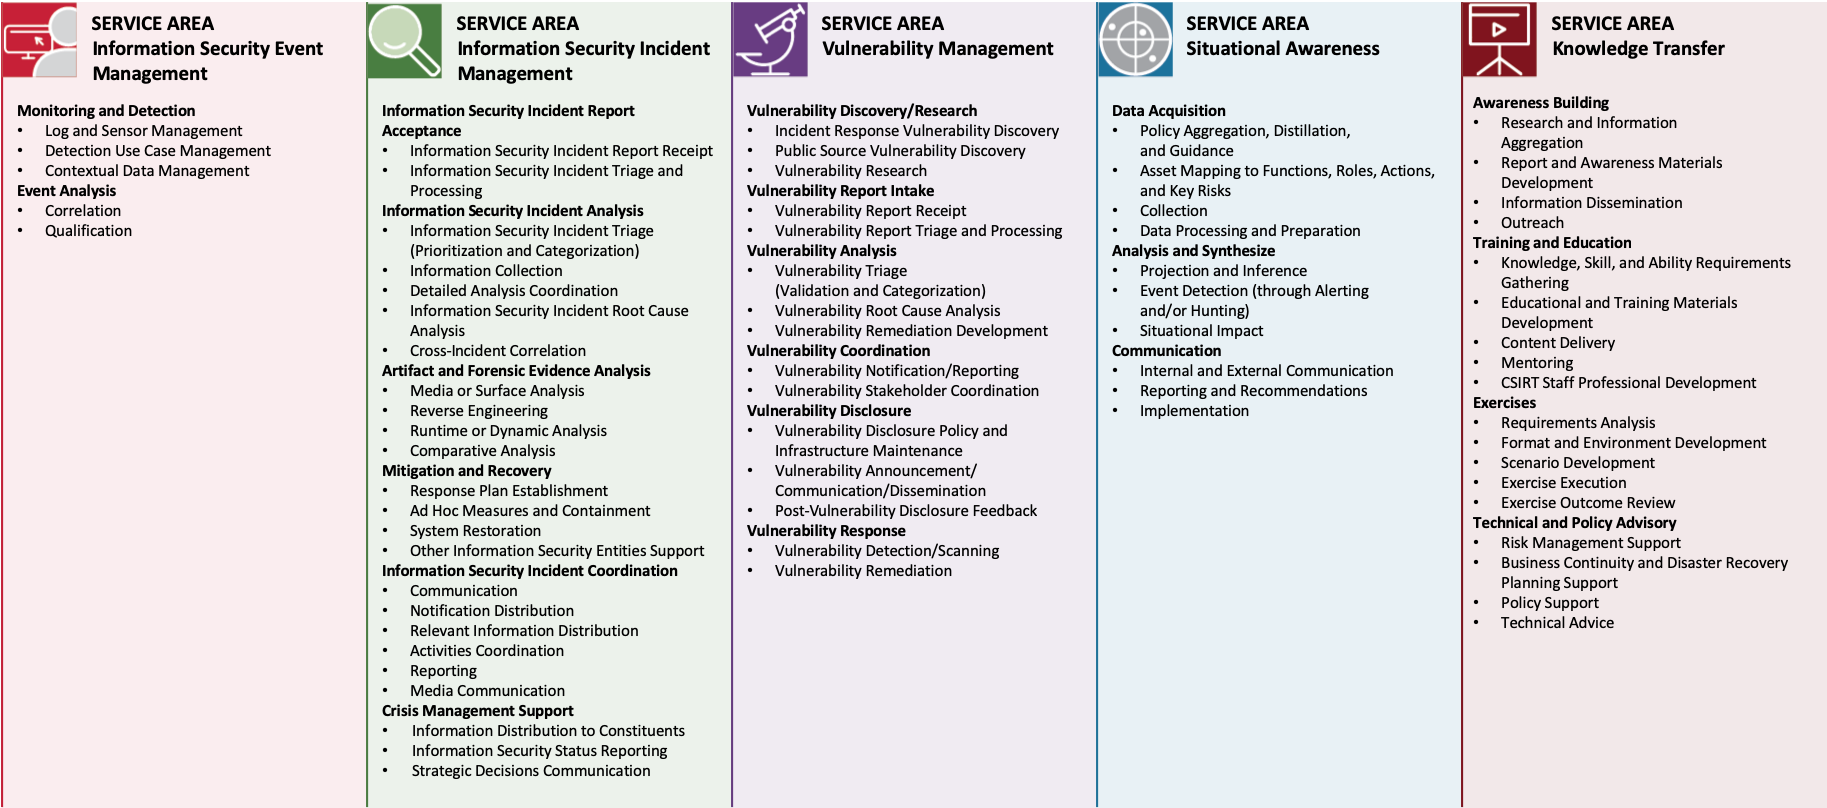
ANNEX 5: Metrics List by Function
ANNEX 6: Revision History
| Version |
Date |
Notes |
| 1.0 |
27 January, 2026 |
Initial version
Contained metrics through Section 7 |
| 1.1 |
01 May, 2026 |
Added metrics for Sections 8 and 9
Minor changes |
We welcome comments and feedback.
Please direct your email to framework-metrics[@]first.org.
